Earthquakes

Earthquakes
...see also
Earthquakes and Seismic Waves in geological processes section
..go back to Contents of entire course...
Earthquakes
Origin of Earthquakes
Seismology, The Study of
Earthquakes
Types of Seismic Waves
Location of Earthquakes
Magnitude of Earthquakes
Earthquake Risk
Earthquake Damage
World Distribution of
Earthquakes
The Earth's Internal Structure
Seismic Wave Velocities in
the Earth
Layers of Different
Physical Properties
Gravity Anomalies and Isostasy
adapted to HTML from lecture notes of Prof. Stephen A. Nelson Tulane
University Earthquakes
Earthquakes occur when energy stored in elastically strained rocks is suddenly released. This release of energy causes intense ground shaking in the area near the source of the earthquake and sends waves of elastic energy, called seismic waves, throughout the Earth. Earthquakes can be generated by bomb blasts, volcanic eruptions, and sudden slippage along faults. Earthquakes are definitely a geologic hazard for those living in earthquake prone areas, but the seismic waves generated by earthquakes are invaluable for studying the interior of the Earth.
Origin of Earthquakes
Most natural earthquakes are caused by sudden slippage along a fault zone. The elastic rebound theory suggests that if slippage along a fault is hindered such that elastic strain energy builds up in the deforming rocks on either side of the fault, when the slippage does occur, the energy released causes an earthquake. This theory was discovered by making measurements at a number of points across a fault. Prior to an earthquake it was noted that the rocks adjacent to the fault were bending. These bends disappeared after an earthquake suggesting that the energy stored in bending the rocks was suddenly released during the earthquake.
Seismology, The Study of Earthquakes
When an earthquake occurs, the elastic energy is released and sends out vibrations that travel throughout the Earth. These vibrations are called seismic waves. The study of how seismic waves behave in the Earth is called seismology.
Seismographs - Seismic waves travel through the Earth as vibrations. A seismometer is an instrument used to record these vibrations and the resulting graph that shows the vibrations is called a seismograph. The seismometer must be able to move with the vibrations, yet part of it must remain nearly stationary.
This is accomplished by isolating the recording device (like a pen) from the rest of the Earth using the principal of inertia. For example, if the pen is attached to a large mass suspended by a spring, the spring and the large mass move less than the paper which is attached to the Earth, and on which the record of the vibrations is made.
Seismic Waves - The source of an earthquake is called the focus, which is an exact location within the Earth were seismic waves are generated by sudden release of stored elastic energy. The epicenter is the point on the surface of the Earth directly above the focus. Sometimes the media get these two terms confused. Seismic waves emanating from the focus can travel in several ways, and thus there are several different kinds of seismic waves.
Types of Seismic Waves
Body Waves - emanate from the focus and travel in all directions through the body of the Earth.
There are two types of body waves:
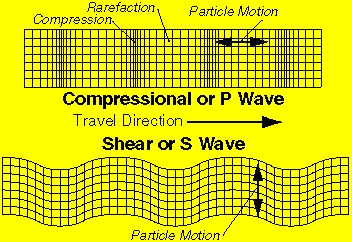
- P - waves - are Primary waves. They travel with a velocity that depends on the elastic properties of the rock through which they travel. Vp = Ö [(K + 4/3m )/r ]
- S-Waves - Secondary waves, also called shear waves. They travel with a velocity that depends only on the rigidity and density of the material through which they travel:
Where, Vp is the velocity of the P-wave, K is the incompressibility
of the material, m is the rigidity of the material, and r is the
density of the material.
Vs = Ö [( m )/r ]
S-waves travel through material by shearing it or changing its shape in the direction perpendicular to the direction of travel. The resistance to shearing of a material is the property called the rigidity. It is notable that liquids have no rigidity, so that the velocity of an S-wave is zero in a liquid. (This point will become important later). Note that S-waves travel slower than P-waves, so they will reach a seismograph after the P-wave.
Surface Waves - Surface waves differ from body waves in that they do not travel through the Earth, but instead travel along paths nearly parallel to the surface of the Earth. Surface waves behave like S-waves in that they cause up and down and side to side movement as they pass, but they travel slower than S-waves and do not travel through the body of the Earth.
The record of an earthquake, a seismograph, as recorded by a seismometer, will be a plot of vibrations versus time. On the seismograph, time is marked at regular intervals, so that we can determine the time of arrival of the first P-wave and the time of arrival of the first S-wave.
P-waves are the same thing as sound waves. They move through the material by compressing it, but after it has been compressed it expands, so that the wave moves by compressing and expanding the material as it travels. Thus the velocity of the P-wave depends on how easily the material can be compressed (the incompressibility), how rigid the material is (the rigidity), and the density of the material. P-waves have the highest velocity of all seismic waves and thus will reach all seismographs first.
Because P-waves have a higher velocity than S-waves, the P-waves arrive at the seismographic station before the S-waves.
Location of Earthquakes
Location of Earthquakes - In order to determine the location of an earthquake, we need to have recorded a seismograph of the earthquake from at least three seismographic stations at different distances from the epicenter of the quake. In addition, we need one further piece of information - that is the time it takes for P-waves and S-waves to travel through the Earth and arrive at a seismographic station. Such information has been collected over the last 80 or so years, and is available as travel time curves.
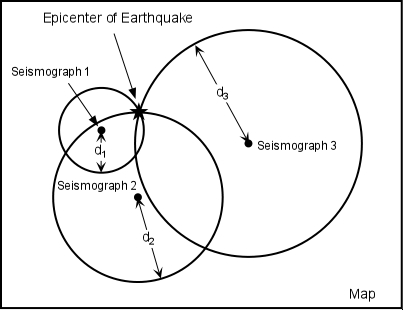
From the seismographs at each station one determines the S-P interval (the difference in the time of arrival of the first S-wave and the time of arrival of the first P-wave. Note that on the travel time curves, the S-P interval increases with increasing distance from the epicenter. Thus the S-P interval tells us the distance to the epicenter from the seismographic station where the earthquake was recorded. Thus at each station we can draw a circle on a map that has a radius equal to the distance from the epicenter.
Three such circles will intersect in a point that locates the epicenter of the earthquake.
Magnitude of Earthquakes
Magnitude of Earthquakes - Whenever a large destructive earthquake occurs in the world the press immediately wants to know where the earthquake occurred and how big the earthquake was (in California the question is usually - Was this the Big One?). The size of an earthquake is usually given in terms of a scale called the Richter Magnitude. Richter Magnitude is a scale of earthquake size developed by a seismologist named Conrad Richter. The Richter Magnitude involves measuring the amplitude (height) of the largest recorded wave at a specific distance from the earthquake. While it is correct to say that for each increase in 1 in the Richter Magnitude, there is a tenfold increase in amplitude of the wave, it is incorrect to say that each increase of 1 in Richter Magnitude represents a tenfold increase in the size of the Earthquake (as is commonly incorrectly stated by the Press).
A better measure of the size of an earthquake is the amount of energy
released by the earthquake. The amount of energy released is related to
the Richter Scale by the following equation:
Where Log refers to the logarithm to the base 10, E is the energy released in ergs, and M is the Richter Magnitude. Anyone with a hand calculator can solve this equation by plugging in various values of M and solving for E, the energy released. I've done the calculation for you in the following table:
From these calculations you can see that each increase in 1 in Richter Magnitude represents a 31 fold increase in the amount of energy released. Thus, a magnitude 7 earthquake releases 31 times more energy than a magnitude 6 earthquake. A magnitude 8 earthquake releases 31 x 31 or 961 times more energy than a magnitude 6 earthquake.
The Hiroshima atomic bomb released an amount of energy equivalent to a magnitude 5.5 earthquake. The largest earthquake recorded, the Alaska earthquake in 1964, had a Richter Magnitude of about 8.6. Note that larger earthquakes are possible, but have not been recorded by humans.
The risk that an earthquake will occur close to where you live depends on whether or not tectonic activity that causes deformation is occurring within the crust of that area. The risk is greatest in the most tectonically active area, that is near the plate margin between Australia and PNG; in New Zealand and on Pacific Islands found on plate boundaries such as Tonga, the Phillipines and Indonesia. Why earthquakes occur in these other areas is not well understood. If earthquakes have occurred before, they are expected to occur again.
Earthquake Damage
Many seismologists have said that "earthquakes don't kill people, buildings do". This is because most deaths from earthquakes are caused by buildings or other human construction falling down during an earthquake. Earthquakes located in isolated areas far from human population rarely cause any deaths. Thus, in earthquake prone areas strict building codes requiring the design and construction of buildings and other structures that will withstand a large earthquake will reduce the death toll.
Damage from earthquakes can be classified as follows:
Rapid Mass-Wasting Processes - In mountainous regions subjected to earthquakes ground shaking may trigger rapid mass-wasting events like rock and debris falls, rock and debris slides, slumps, and debris avalanches.
Liquefaction - Liquefaction is a processes that occurs in water-saturated unconsolidated sediment due to shaking. In areas underlain by such material, the groundshaking causes the grains to loose grain to grain contact, and thus the material tends to flow. You can demonstrate this process to yourself next time your go the beach. Stand on the sand just after an incoming wave has passed. The sand will easily support your weight and you will not sink very deeply into the sand if you stand still. But, if you start to shake your body while standing on this wet sand, you will notice that the sand begins to flow as a result of liquefaction, and your feet will sink deeper into the sand.
Tsunamis -
Tsunamis are giant ocean waves that can rapidly travel across oceans, as we discussed in the Oceans and Their Margins. Earthquakes that occur along coastal areas can generate tsunamis, which can cause damage thousands of kilometers away on the other side of the ocean.
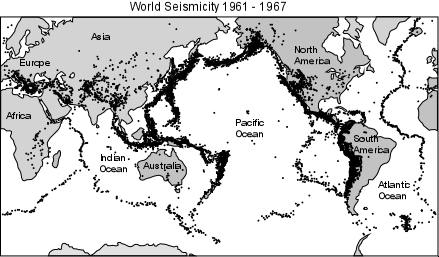
The distribution of earthquakes is referred to as seismicity. Most earthquakes occur along relatively narrow belts that coincide with plate boundaries This makes sense, since plate boundaries are zones along which lithospheric plates mover relative to one another. Earthquakes along these zones can be divided into shallow focus earthquakes that have focal depths less than about 70 km and deep focus earthquakes that have focal depths between 75 and 700 km.
Earthquakesat
Much of what we know about the interior of the Earth comes from knowledge of seismic wave velocities and their variation with depth in the Earth. Recall that body wave velocities are as follows: Vp = Ö [(K + 4/3m )/r ] Vs = Ö [( m )/r ] Where K = incompressibility m = rigidity r = density If the properties of the earth, i.e. K, m, and r where the same throughout, then Vp and Vs would be constant throughout the Earth and seismic waves would travel along straight line paths through the Earth. We know however that density must change with depth in the Earth, because the density of the Earth is 5,200 kg/cubic meter and density of crustal rocks is about 2,500 kg/cubic meter. If the density were the only property to change, then we could make estimates of the density, and predict the arrival times or velocities of seismic waves at any point away from an earthquake. Observations do not follow the predictions, so, something else must be happening. In fact we know that K, m, and r change due to changing temperatures, pressures and compositions of material. The job of seismology is, therefore, to use the observed seismic wave velocities to determine how K, m, and r change with depth in the Earth, and then infer how P, T, and composition change with depth in the Earth. In other words to tell us something about the internal structure of the Earth.
Reflection and Refraction of Seismic Waves
Log E = 11.8 + 1.5 M
Where Log refers to the logarithm to the base 10, E is the energy released in ergs, and M is the Richter Magnitude. Anyone with a hand calculator can solve this equation by plugging in various values of M and solving for E, the energy released. I've done the calculation for you in the following table:
| Richter Magnitude | Energy (ergs) | Factor |
|---|---|---|
| 1 | 2.0 x 10¹³ | 31 x |
| 2 | 6.3 x 10¹⁴ | |
| 3 | 2.0 x 10¹⁶ | 31 x |
| 4 | 6.3 x 10¹⁷ | |
| 5 | 2.0 x 10¹⁹ | 31 x |
| 6 | 6.3 x 10²⁰ | |
| 7 | 2.0 x 10²² | 31 x |
| 8 | 6.3 x 10²³ |
From these calculations you can see that each increase in 1 in Richter Magnitude represents a 31 fold increase in the amount of energy released. Thus, a magnitude 7 earthquake releases 31 times more energy than a magnitude 6 earthquake. A magnitude 8 earthquake releases 31 x 31 or 961 times more energy than a magnitude 6 earthquake.
The Hiroshima atomic bomb released an amount of energy equivalent to a magnitude 5.5 earthquake. The largest earthquake recorded, the Alaska earthquake in 1964, had a Richter Magnitude of about 8.6. Note that larger earthquakes are possible, but have not been recorded by humans.
Earthquake Risk
The risk that an earthquake will occur close to where you live depends on whether or not tectonic activity that causes deformation is occurring within the crust of that area. The risk is greatest in the most tectonically active area, that is near the plate margin between Australia and PNG; in New Zealand and on Pacific Islands found on plate boundaries such as Tonga, the Phillipines and Indonesia. Why earthquakes occur in these other areas is not well understood. If earthquakes have occurred before, they are expected to occur again.
Earthquake Damage
Many seismologists have said that "earthquakes don't kill people, buildings do". This is because most deaths from earthquakes are caused by buildings or other human construction falling down during an earthquake. Earthquakes located in isolated areas far from human population rarely cause any deaths. Thus, in earthquake prone areas strict building codes requiring the design and construction of buildings and other structures that will withstand a large earthquake will reduce the death toll.
Damage from earthquakes can be classified as follows:
- Ground Shaking - Shaking of the ground caused by the passage of seismic waves near the epicenter of the earthquake is responsible for the collapse of most structures. The intensity of ground shaking depends on distance from the epicenter and on the type of bedrock underlying the area.
- In general, loose unconsolidated sediment is subject to more intense shaking than solid bedrock.
- Damage to structures from shaking depends on the type of construction. Concrete and masonry structures, because they are brittle are more susceptible to damage than wood and steel structures, which are more flexible.
- Ground Rupture - Ground rupture only occurs along the fault zone that moves during the earthquake. Thus structures that are built across fault zones may collapse, whereas structures built adjacent to, but not crossing the fault may survive.
- Fire - Fire is a secondary effect of earthquakes. Because power lines may be knocked down and because natural gas lines may rupture due to an earthquake, fires are often started closely following an earthquake. The problem is compounded if water lines are also broken during the earthquake since there will not be a supply of water to extinguish the fires once they have started. In the 1906 earthquake in San Francisco more than 90% of the damage to buildings was caused by fire.
Rapid Mass-Wasting Processes - In mountainous regions subjected to earthquakes ground shaking may trigger rapid mass-wasting events like rock and debris falls, rock and debris slides, slumps, and debris avalanches.
Liquefaction - Liquefaction is a processes that occurs in water-saturated unconsolidated sediment due to shaking. In areas underlain by such material, the groundshaking causes the grains to loose grain to grain contact, and thus the material tends to flow. You can demonstrate this process to yourself next time your go the beach. Stand on the sand just after an incoming wave has passed. The sand will easily support your weight and you will not sink very deeply into the sand if you stand still. But, if you start to shake your body while standing on this wet sand, you will notice that the sand begins to flow as a result of liquefaction, and your feet will sink deeper into the sand.
Tsunamis -
Tsunamis are giant ocean waves that can rapidly travel across oceans, as we discussed in the Oceans and Their Margins. Earthquakes that occur along coastal areas can generate tsunamis, which can cause damage thousands of kilometers away on the other side of the ocean.
World Distribution of Earthquakes
The distribution of earthquakes is referred to as seismicity. Most earthquakes occur along relatively narrow belts that coincide with plate boundaries This makes sense, since plate boundaries are zones along which lithospheric plates mover relative to one another. Earthquakes along these zones can be divided into shallow focus earthquakes that have focal depths less than about 70 km and deep focus earthquakes that have focal depths between 75 and 700 km.
Earthquakesat
- Diverging Plate Boundaries. Diverging plate boundaries are zones where two plates move away from each other, such as at oceanic ridges. In such areas the lithosphere is in a state of tensional stress and thus normal faults and rift valleys occur. Earthquakes that occur along such boundaries show normal fault motion and tend to be shallow focus earthquakes, with focal depths less than about 20 km. Such shallow focal depths indicate that the brittle lithosphere must be relatively thin along these diverging plate boundaries.
- Earthquakes at Transform Fault Boundaries. Transform fault boundaries are plate boundaries where lithospheric plates slide past one another in a horizontal fashion. The San Andreas Fault of California is one of the longer transform fault boundaries known. Earthquakes along these boundaries show strike-slip motion on the faults and tend to be shallow focus earthquakes with depths usually less than about 50 km.
- Earthquakes at Converging Plate Boundaries - Convergent plate boundaries are boundaries where two plates run into each other. Thus, they tend to be zones where compressional stresses are active and thus reverse faults or thrust faults are common. There are two types of converging plate boundaries. (1) subduction boundaries, where oceanic lithosphere is pushed beneath either oceanic or continental lithosphere; and (2) collision boundaries where two plates with continental lithosphere collide.
- Subduction boundaries -At subduction boundaries cold oceanic lithosphere is pushed back down into the mantle where two plates converge at an oceanic trench. Because the subducted lithosphere is cold it remains brittle as it descends and thus can fracture under the compressional stress. When it fractures, it generates earthquakes that define a zone of earthquakes with increasing focal depths beneath the overriding plate. This zone of earthquakes is called the Benioff Zone. Focal depths of earthquakes in the Benioff Zone can reach down to 700 km.
- Collision boundaries - At collisional boundaries two plates of continental lithosphere collide resulting in fold-thrust mountain belts. Earthquakes occur due to the thrust faulting and range in depth from shallow to about 200 km.
The Earth's Internal Structure
Much of what we know about the interior of the Earth comes from knowledge of seismic wave velocities and their variation with depth in the Earth. Recall that body wave velocities are as follows: Vp = Ö [(K + 4/3m )/r ] Vs = Ö [( m )/r ] Where K = incompressibility m = rigidity r = density If the properties of the earth, i.e. K, m, and r where the same throughout, then Vp and Vs would be constant throughout the Earth and seismic waves would travel along straight line paths through the Earth. We know however that density must change with depth in the Earth, because the density of the Earth is 5,200 kg/cubic meter and density of crustal rocks is about 2,500 kg/cubic meter. If the density were the only property to change, then we could make estimates of the density, and predict the arrival times or velocities of seismic waves at any point away from an earthquake. Observations do not follow the predictions, so, something else must be happening. In fact we know that K, m, and r change due to changing temperatures, pressures and compositions of material. The job of seismology is, therefore, to use the observed seismic wave velocities to determine how K, m, and r change with depth in the Earth, and then infer how P, T, and composition change with depth in the Earth. In other words to tell us something about the internal structure of the Earth.
Reflection and Refraction of Seismic Waves
If composition (or physical properties) change abruptly at some
interface, then seismic
wave
will both reflect off the interface and refract (or bend) as they
pass through the interface.
Three cases of wave refraction can be recognised.
One of the earliest discoveries of seismology was a discontinuity at a depth of 2900 km where the velocity of P-waves suddenly decreases. This boundary is the boundary between the mantle and the core and was discovered because of a zone on the opposite side of the Earth from an Earthquake focus receives no direct P-waves because the P-waves are refracted inward as a result of the sudden decrease in velocity at the boundary. This zone is called a P-wave shadow zone.
This discovery was followed by the discovery of an S-wave shadow zone. The S-wave shadow zone occurs because no S-waves reach the area on the opposite side of the Earth from the focus. Since no direct S-waves arrive in this zone, it implies that no S-waves pass through the core. This further implies the velocity of S-wave in the core is 0. In liquids m = 0, so S-wave velocity is also equal to 0. From this it is deduced that the core, or at least part of the core is in the liquid state, since no S-waves are transmitted through liquids. Thus, the S-wave shadow zone is best explained by a liquid outer core.
Over the years seismologists have collected data on how seismic wave velocities vary with depth in the Earth. Distinct boundaries, called discontinuities are observed when there is sudden change in physical properties or chemical composition of the Earth. From these discontinuities, we can deduce something about the nature of the various layers in the Earth. As we discussed way back at the beginning of the course, we can look at the Earth in terms of layers of differing chemical composition, and layers of differing physical properties.
Layers of Differing Composition
The shape of earth is not a uniform sphere, but bulges at equator due to centrifugal force of rotation. Thus radius at equator is about 21 km greater than at poles. Since gravity is a force of attraction between two bodies and is inversely proportional to the distance between the two bodies, the pull of gravity is greater at the poles than at the equator. Thus, a person weighing 90.5 kg (199 lbs.) at the pole would weigh 90 kg (198 lbs.) at equator. But the variation is not smooth, there are topographic effects and differences in the mass of rock bodies near the Earth's surface. Gravity Measurements and Gravity Anomalies
Gravity is measured with a device known as a gravimeter. A gravimeter can measure differences in the pull of gravity to as little as 1 part in 100 million. Measurements of gravity can detect areas where there is a deficiency or excess of mass beneath the surface of the Earth. These deficiencies or excesses of mass are called gravity anomalies.
A positive gravity anomaly indicates that an excess of mass exits beneath the area.
A negative gravity anomaly indicates that there is less mass beneath an area.
Negative anomalies exist beneath mountain ranges, and mirror the topography and crustal thickness as determined by seismic studies. Thus, the low density continents appear to be floating on higher density mantle.
Isostasy
The Principle of isostasy states that there is a flotational balance between low density rocks and high density rocks. i.e. low density crustal rocks float on higher density mantle rocks. The height at which the low density rocks float is dependent on the thickness of the low density rocks. Continents stand high because they are composed of low density rocks (granitic composition). Ocean basins stand low, because they are composed of higher density basaltic and gabbroic rocks.
Isostasy is best illustrated by effects of glaciation. During an ice age crustal rocks that are covered with ice are depressed by the weight of the overlying ice. When the ice melts, the areas previously covered with ice have been uplifted.
Three cases of wave refraction can be recognised.
- If the seismic wave velocity in the rock above an interface is less than the seismic wave velocity in the rock below the interface, the waves will be refracted or bent upward relative to their original path.
- If the seismic wave velocity decreases when passing into the rock below the interface, the waves will be refracted down relative to their original path.
- If the seismic wave velocities gradually increase with depth in the Earth, the waves will continually be refracted along curved paths that curve back toward the Earth's surface.
One of the earliest discoveries of seismology was a discontinuity at a depth of 2900 km where the velocity of P-waves suddenly decreases. This boundary is the boundary between the mantle and the core and was discovered because of a zone on the opposite side of the Earth from an Earthquake focus receives no direct P-waves because the P-waves are refracted inward as a result of the sudden decrease in velocity at the boundary. This zone is called a P-wave shadow zone.
This discovery was followed by the discovery of an S-wave shadow zone. The S-wave shadow zone occurs because no S-waves reach the area on the opposite side of the Earth from the focus. Since no direct S-waves arrive in this zone, it implies that no S-waves pass through the core. This further implies the velocity of S-wave in the core is 0. In liquids m = 0, so S-wave velocity is also equal to 0. From this it is deduced that the core, or at least part of the core is in the liquid state, since no S-waves are transmitted through liquids. Thus, the S-wave shadow zone is best explained by a liquid outer core.
Seismic Wave Velocities in the Earth
Over the years seismologists have collected data on how seismic wave velocities vary with depth in the Earth. Distinct boundaries, called discontinuities are observed when there is sudden change in physical properties or chemical composition of the Earth. From these discontinuities, we can deduce something about the nature of the various layers in the Earth. As we discussed way back at the beginning of the course, we can look at the Earth in terms of layers of differing chemical composition, and layers of differing physical properties.
Layers of Differing Composition
- The Crust - Mohorovicic discovered boundary the boundary between crust and mantle, thus it is named the Mohorovicic Discontinuity or Moho, for short. 25-30km thick The composition of the crust can be determined from seismic waves by comparing seismic wave velocities measured on rocks in the laboratory with seismic wave velocities observed in the crust. Then from travel times of waves on many earthquakes and from many seismic stations, the thickness and composition of the crust can be inferred.
- In the ocean basins crust is about 8 to 10 km thick, and has a composition that is basaltic.
- The Mantle - Seismic wave velocities increase abruptly at the Moho. In the mantle wave velocities are consistent with a rock composition of peridotite which consists of olivine, pyroxene, and garnet.
- The Core - At a depth of 2900 Km P-wave velocities suddenly decrease and S-wave velocities go to zero. This is the top of the outer core. As discussed above, the outer core must be liquid since S-wave velocities are 0. At a depth of about 4800 km the sudden increase in P-wave velocities indicate a solid inner core. The core appears to have a composition consistent with mostly Iron with small amounts of Nickel.
Layers of
Different Physical Properties
- At a depth of about 100 km there is a sudden decrease in both P and S-wave velocities. This boundary marks the base of the lithosphere and the top of the asthenosphere. The lithosphere is composed of both crust and part of the upper mantle. It is a brittle layer that makes up the plates in plate tectonics, and appears to float and move around on top of the more ductile asthenosphere.
- At the top of the asthenosphere is a zone where both P- and S-wave velocities are low. This zone is called the Low-Velocity Zone (LVZ). It is thought that the low velocities of seismic waves in this zone are caused by temperatures approaching the partial melting temperature of the mantle, causing the mantle in this zone to behave in a very ductile manner.
- At a depth of 400 km there is an abrupt increase in the velocities of seismic waves, thus this boundary is known as the 400 - Km Discontinuity. Experiments on mantle rocks indicate that this represents a temperature and pressure where there is a polymorphic phase transition, involving a change in the crystal structure of Olivine, one of the most abundant minerals in the mantle.
- Another abrupt increase in seismic wave velocities occurs at a depth of 670 km. It is uncertain whether this discontinuity, known as the 670 Km Discontinuity, is the result of a polymorphic phase transition involving other mantle minerals or a compositional change in the mantle, or both.
Gravity Anomalies and Isostasy
The shape of earth is not a uniform sphere, but bulges at equator due to centrifugal force of rotation. Thus radius at equator is about 21 km greater than at poles. Since gravity is a force of attraction between two bodies and is inversely proportional to the distance between the two bodies, the pull of gravity is greater at the poles than at the equator. Thus, a person weighing 90.5 kg (199 lbs.) at the pole would weigh 90 kg (198 lbs.) at equator. But the variation is not smooth, there are topographic effects and differences in the mass of rock bodies near the Earth's surface. Gravity Measurements and Gravity Anomalies
Gravity is measured with a device known as a gravimeter. A gravimeter can measure differences in the pull of gravity to as little as 1 part in 100 million. Measurements of gravity can detect areas where there is a deficiency or excess of mass beneath the surface of the Earth. These deficiencies or excesses of mass are called gravity anomalies.
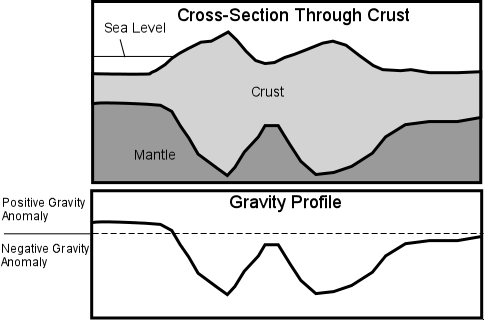
A positive gravity anomaly indicates that an excess of mass exits beneath the area.
A negative gravity anomaly indicates that there is less mass beneath an area.
Negative anomalies exist beneath mountain ranges, and mirror the topography and crustal thickness as determined by seismic studies. Thus, the low density continents appear to be floating on higher density mantle.
Isostasy
The Principle of isostasy states that there is a flotational balance between low density rocks and high density rocks. i.e. low density crustal rocks float on higher density mantle rocks. The height at which the low density rocks float is dependent on the thickness of the low density rocks. Continents stand high because they are composed of low density rocks (granitic composition). Ocean basins stand low, because they are composed of higher density basaltic and gabbroic rocks.
Isostasy is best illustrated by effects of glaciation. During an ice age crustal rocks that are covered with ice are depressed by the weight of the overlying ice. When the ice melts, the areas previously covered with ice have been uplifted.