River Systems, Flooding, Flood Mitigation and Flood Exercise

River Systems, Flooding, Flood Mitigation and Flood Exercise
adapted to HTML from lecture notes of Prof. Stephen A. Nelson Tulane University
Flooding
Causes of Flooding
Stream Systems
Factors that Affect Flooding
Hazards Associated with
Flooding
Predicting River Flooding
Flood Hazard Mapping
Human Intervention
Flooding
Cyber-Learning
Flooding
Throughout history humans have found it desirable to construct cities along streams. Streams are sources of water for consumption, agriculture, and industry. Streams provide transportation routes, energy, and a means of disposal of wastes. Stream valleys offer a relatively flat area for construction. But, human populations that live along streams also have the disadvantage that the flow of water in streams is never constant. High amounts of water flowing in streams often leads to flooding, and flooding is one of the more common and costly types of natural disasters.
A flood results when a stream runs out of its confines and submerges surrounding areas.
In less developed countries, humans are particularly sensitive to flood casualties because of high population density, absence of zoning regulations, lack of flood control, and lack of emergency response infrastructure and early warning systems. Bangladesh is one of the most susceptible countries to flood disasters. About one half of the land area in Bangladesh is at an elevation of less than 8 meters above sea level. Up to 30% of the country has been covered with flood waters. In 1991 more 200,000 deaths resulted from flooding and associated tropical cyclones.
In industrialized countries the loss of life is usually lower because of flood control structures, zoning regulations that prevent the habitation of seriously vulnerable lands, and emergency preparedness. Still, property damage and disruption of life takes a great toll, and despite flood control structures and land use planning, floods still do occur.
Causes of Flooding
From a geological perspective, floods are a natural consequence of stream flow in a continually changing environment. Floods have been occurring throughout Earth history, and are expected so long as the water cycle continues to run. Streams receive most of their water input from precipitation, and the amount of precipitation falling in any given drainage basin varies from day to day, year to year, and century to century.
The Role of Precipitation
Weather patterns determine the amount and location of rain and snowfall. Unfortunately the amount and time over which precipitation falls is not constant for any given area. Overall, the water cycle is a balanced system. Water flowing into one part of the cycle (like streams) is balanced by water flowing back to the ocean. But sometimes the amount flowing in to one area is greater than the capacity of the system to hold it within natural confines. The result is a flood. Combinations of factors along with exceptional precipitation can also lead to flooding. For example, heavy snow melts, water saturated ground, unusually high tides, and drainage modifications when combined with heavy rain can lead to flooding.
Coastal Flooding
Areas along coastlines become subject to flooding as a result of tsunamis, hurricanes (cyclonic storms), and unusually high tides. In addition, long term processes like subsidence and rising sea level as a result of global warming can lead to the encroachment of the sea on to the land.
Dam Failures
Dams occur as both natural and human constructed features. Natural dams are created by volcanic events (lava flows and pyroclastic flows), landslides, or blockage by ice. Human constructed dams are built for water storage, generation of electrical power, and flood control. All types of dams may fail with the sudden release of water into the downstream drainage. Spectacular and devastating examples of dam failures include that resulting in flooding downstream include:
The St. Francis Dam, near Saugus, California, failed in 1929 killing 450 people. The Johnstown, Pennsylvania dam, built of earthen material (soil and rock) collapsed after a period of heavy rainfall in 1889. 2,200 people were killed by the flood.
The Vaiont Dam in Italy (discussed in a previous lecture on mass-wasting) did not fail in 1963, but the landslides that moved into the reservoir behind the dam caused water to overtop the dam killing over 3,000 people.
Stream Systems
A stream is a body of water that carries rock particles and dissolved ions and flows down slope along a clearly defined path, called a channel. Thus streams may vary in width from a few centimeters to several kilometers. Streams are important for several reasons
Streams carry most of the water that goes from the land to the sea, and thus are an important part of the water cycle.
Streams carry billions of tons of sediment to lower elevations, and thus are one of the main transporting mediums in the production of sedimentary rocks. Streams carry dissolved ions, the products of chemical weathering, into the oceans and thus make the sea salty.
Streams are a major part of the erosional process, working in conjunction with weathering and mass wasting. Much of the surface landscape is controlled by stream erosion, evident to anyone looking out of an airplane window. Streams are a major source of water and transportation for the world's human population. Most population centers are located next to streams.River Flooding
Having covered the basics of stream systems we now turn our attention to the details of flooding associated with rivers and streams.
Flood Stage
The term stage refers to the height of a river (or any other body of water) above a locally defined elevation. This locally defined elevation is a reference level, often referred to as datum. For example, for the lower part of the Mississippi River, reference level or datum, is sea level, (0 feet).
Currently the Mississippi River is at a stage of about 5 feet, that is 5 feet above sea level.
Other river systems have a reference level that is not sea level.
Most rivers in the United States have gaging stations where measurements are continually made of the river's stage and discharge.
These are plotted on a graph called a hydrograph, which shows the stage or discharge of the river, as measured at the gaging station, versus time.
When the discharge of a river increases, the channel may become completely full.
Any discharge above this level will result in the river overflowing its banks and causing a flood.
The stage at which the river will overflow its banks is called bankfull stage or flood stage.
For example, the flood stage of the Mississippi River at New Orleans 17 feet.
Discharge that produces a stage over 17 feet will result in the water nearing the top of the levee with potential flooding of the city of New Orleans (the top of the levee is actually at 23 feet above sea level).
(Note that for the Mississippi River and other large rivers in Louisiana, the current stage and flood stage are published on a daily basis in the weather section of the Times-Picayune newspaper).
Discharge is not linearly related to stage because discharge depends on both the depth and width of the stream channel, or more precisely, on the cross-sectional shape of the channel. Stage refers only to the height of the water above some reference level. For example, the graph below is a hydrograph of the Mississippi River at St. Louis, Missouri during the time period of the 1993 flood.
Discharge is plotted on the Y-axis, and dates are plotted on the x-axis.
Note that stages corresponding to various discharges are shown on the left-hand y-axis, and that the spacing between equal units of stage are not equal along the y-axis.
(Figure 8.13, p. 200 in your text shows a similar graph with stage in meters above datum shown as the primary y-axis).
Note that for the 1993 Mississippi River Flood, the river reached flood stage of 30 feet above datum on about June 26 and peaked (or crested) at just under 50 feet above datum on August 1.
The sudden drops seen in discharge around July 15 and July 20 corresponded to breaks in the levee system upstream from St. Louis that caused water to flow onto the floodplain upstream, thus reducing both the stage and discharge measured at St. Louis.
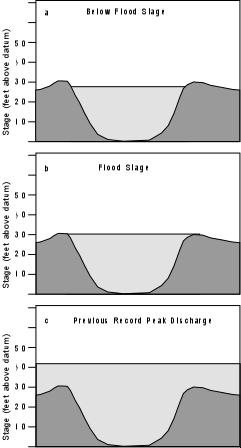
To illustrate, for the Mississippi River flood at St. Louis, idealized cross sections of the River are shown below for points a, b, and c in the diagram above.
Factors that Affect Flooding
As discussed previously the main factors that cause flooding are heavy rainfall, sudden or heavy snow melt, and dam failure.
Now that we understand something about levees and floodplains, we can add to this list the possibility of levee failure.
All of these factors can suddenly increase discharge of water into streams, within streams, and out of streams. Furthermore,
as we have just seen, when the discharge causes the river to rise above flood stage water runs onto the floodplain.
Here we discuss the main cause of flooding, that is heavy rainfall over a short period of time.
When rain falls on the surface of the Earth, some of the water is evaporated and returns to the atmosphere, some of it infiltrates the soil and moves downward into the groundwater system, and some is intercepted by depressions and vegetation.
What remains on the surface of the Earth and eventually flows into streams is called runoff.
In general, then:
Runoff = Precipitation - Infiltration - Interception - Evaporation
Evaporation tends to be the least of these quantities, particularly over short periods of time, and thus precipitation, infiltration, and interception are the most important variables that determine runoff and eventual discharge into streams.
Rainfall Distribution
If rainfall is heavier than normal in a particular area, and infiltration, interception, and evaporation are low then runoff can be high and the likelihood of flooding will increase.
Heavy rainfall can be depicted on maps that show curves of equal rainfall.
Such curves are called isohyets, and the resulting maps are called isohyetal maps.
An example of an isohyetal map is shown in figure 8.15, page 202 in your text.
This figure shows the area of the 1993 Mississippi River Valley flooding, with isohyets representing the percentage above 30 year normal rainfall during the first half of 1993.
Note that most of the area received between 150% and 200% of normal rainfall in the months leading up to the flooding.
Lag Time - The time difference between when heavy precipitation occurs and when peak discharge occurs in the streams draining an area is called lag time.
Lag time depends on such factors as the amount of time over which the rain falls and the amount of infiltration and interception that takes place along the path to a stream.
If the amount of rain is high over a short time period, lag time is short.
If the amount of rain is high over a longer time period, lag time is longer.
Lack of infiltration and interception reduce lag time.
Upstream flooding and flash floods
In areas where large amounts of rain fall over a short period of time within a small area, streams in the local area may flood, with little or no effect on areas downstream.
Such floods are referred to as upstream floods.
In such floods, water rises quickly and flows away quickly after the storm has passed.
Lag times are measured in days.
Flash floods occur when the rate of infiltration is low and heavy rains occur over a short period of time.
They are upstream floods with very little lag time (lag times may be only a few hours).
Because they come with little warning, flash floods are the most dangerous to human lives.
Downstream flooding
If large amounts of rain fall over an extended period of time over a large region, downstream floods may occur. Lag times are usually longer as tributary streams continually increase the discharge into larger streams. Such floods extend over long periods of time and affect the larger streams as well as tributary streams.
The 1993 flood on the upper Mississippi River is considered a downstream flood. Water levels rise slowly and dissipate slowly (in the case of the 1993 flood, the increase in discharge to the peak occurred over several weeks after several weeks of intense rainfall, and it took several months for river stages to return to normal levels).
(Note that figure 8.16, page 203 in your text attempts to show the difference between upstream floods and downstream floods.
As far as I can tell it does not show such a difference.
The lower figure should show high water levels on all stretches of the main river and its tributaries).
Infiltration
Infiltration is controlled by how readily the water can seep into the soil, be absorbed by the soil, and work its way down to the water table. Several factors determine the rate of infiltration:
Extent of water saturation of the soil
If the soil is already saturated with water and the water table has risen as a result of rainfall prior to a heavy storm, then little further water can infiltrate the soil, and the rate of infiltration will be highly decreased.
Vegetation cover
Vegetation can aid infiltration by slowing the flow of water over the surface and providing passageways along root systems for water to enter the soil.
In desert regions or areas that have recently been deforested either by fires or humans, infiltration will be reduced, thus increasing the rate of runoff and decreasing the lag time.
Soil types (dependent on climate)
Different soil types have different capacities to absorb moisture. Soil type is to a large extent dependent on climate.
For example a type of soil that forms in dry, desert-like environments has a thin layer of poorly developed soil overlying a crust of caliche.
Caliche is calcium carbonate that has precipitated out of water infiltrating though the thin soil. The caliche zone acts as an impermeable layer though which water can only penetrate with difficulty.
Such soils in deserts, combined with the lack of vegetation make flash flooding in desert areas more common.
Frozen ground
If the ground is frozen little water can penetrate. Thus rainfall after a period of cold temperatures may not be able to infiltrate through the frozen ground.
Human construction
Humans tend to pave the Earth with such things as parking lots, highways, sidewalks, and plazas that prevent infiltration of water into the soil.
Furthermore they tend to channel the water into storm sewer systems and concrete lined drainages, all of which increase runoff and decrease infiltration.
Levee Failures
Natural levees are constructed as a result of flooding, as we saw in the discussion last lecture. But, natural levees tend to be relatively low and do not offer much protection from large discharge because they can easily be overtopped.
Human made levees, such as we see on the Mississippi River along much of its length, are much higher and are constructed to prevent flooding from high discharges on the River.
Most levees are constructed of piles of dirt (rock and soil) with a concrete cover on the river side of the levee.
Such levees often give a false sense of security for those living on the floodplain the levee was built to protect, because failure of such levees can lead to flooding, either because discharge can
e great enough to overtop the levees or the levees can become weakened and fail.
Levees can fail for three main reasons.
Overtopping of levees
If high discharge in the river leads to a river stage that is higher than any point on a levee, the water will overtop the levee and start to flow onto the floodplain.
Because the initial gradient from the river to flood plain is relatively high, the velocity of the stream as it overtops the levee will be high.
High velocities can result in high rates of erosion, and thus the levee that is initially overtopped will soon become eroded and a channel through the levee will soon be created.
Undercutting and slumping of levee
Higher discharge in the river will lead to higher velocities with the stream trying to increase its width and depth.
Higher velocities can lead to higher rates of erosion along the inner parts of levees and thus lead to undercutting and slumping of the levee into the river.
Heavy rainfall or seepage into the levee from the river can increase fluid pressure in the levee and lead to slumping on the outer parts of the levee.
If the slumps grow to the top of the levee, large sections of the levee may slump onto the floodplain and lower the elevation of the top of the levee, allowing it to be more easily overtopped.
Buildup of fluid pressure beneath levees
Increasing levels of water in the river will cause the water table in the levee to rise.
This will also increase fluid pressure and may result in water being pushed through the levee to rise as springs on the surrounding flood plains. If a high rate of flow is developed due to the increased fluid pressures, then a high velocity pathway to the flood plain may develop and undermine the levee causing its collapse anure.
Hazards Associated with Flooding
Hazards associated with flooding can be divided into primary hazards that occur due to contact with
water, secondary effects that occur because of the flooding, such as disruption of services, health impacts such as famine and disease, and tertiary effects such as changes in the position of river channels.
Throughout the last century flooding has been one of the most costly disasters in terms of both property damage and human casualties.
Major floods in China, for example, killed about 2 million people in 1887, nearly 4 million in 1931, and about 1 million in 1938 (Note: these figures disagree with those in Table 8.1, page 204 in your text.
I have researched this, and I think that your textbook is wrong).
The 1993 flood on the upper Mississippi River and Midwest killed only 47 people, but the U.S. Army Corps of Engineers estimates the total economic loss at between 15 and 20 billion dollars (http://www.mvr.usace.army.mil/PublicAffairsOffice/HistoricArchives/Floodof1993/pafr.htm).
Primary Effects
Again, the primary effects of floods are those due to direct contact with the flood waters.
As seen in the video last lecture, water velocities tend to be high in floods.
As discharge increases velocity increases.
With higher velocities, streams are able to transport larger particles as suspended load.
Such large particles include not only rocks and sediment, but, during a flood, could include such large objects as automobiles, houses and bridges.
Massive amounts of erosion can be accomplished by flood waters. Such erosion can undermine bridge structures, levees, and buildings causing their collapse.
Water entering human built structures cause water damage.
Even with minor flooding of homes, furniture is ruined, floors and walls are damaged, and anything that comes in contact with the water is likely to be damaged or lost.
Flooding of automobiles usually results in damage that cannot easily be repaired.
The high velocity of flood waters allows the water to carry more sediment as suspended load. When the flood waters retreat, velocity is generally much lower and sediment is deposited. After retreat of the floodwaters everything is usually covered with a thick layer of stream deposited mud, including the interior of buildings.
Flooding of farmland usually results in crop loss.Livestock, pets, and other animals are often carried away and drown.
Humans that get caught in the high velocity flood waters are often drowned by the water.
Floodwaters can concentrate garbage, debris, and toxic pollutants that can cause the secondary effects of health hazards.
Secondary and Tertiary Effects
Remember that secondary effects are those that occur because of the primary effects and tertiary effects are the long term changes that take place. Among the secondary effects of a flood are:
Disruption of services -
Drinking water supplies may become polluted, especially if sewerage treatment plants are flooded.
This may result in disease and other health effects, especially in under developed countries.
Gas and electrical service may be disrupted.
Transportation systems may be disrupted, resulting in shortages of food and clean-up supplies. In under developed countries food shortages often lead to starvation.
Long - term effects (tertiary effects)-
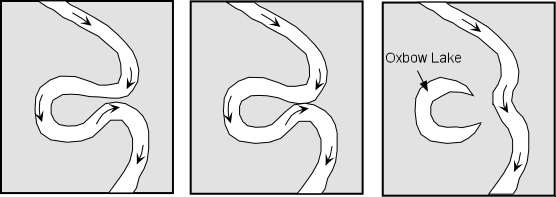
Location of river channels may change as the result of flooding, new channels develop, leaving the old channels dry.
Sediment deposited by flooding may destroy farm land (although silt deposited by floodwaters could also help to increase agricultural productivity).
Jobs may be lost due to the disruption of services, destruction of business, etc. (although jobs may be gained in the construction industry to help rebuild or repair flood damage.
Insurance rates may increase.
Corruption may result from misuse of relief funds.
Destruction of wildlife habitat.
Predicting River Flooding
Floods can be such devastating disasters that anyone can be affected at almost anytime. As we have seen, when water falls on the surface of the Earth, it has to go somewhere. In order to reduce the risk due to floods, three main approaches are taken to flood prediction. Statistical studies can be undertaken to attempt to determine the probability and frequency of high discharges of streams that cause flooding. Floods can be modeled and maps can be made to determine the extent of possible flooding when it occurs in the future. And, since the main causes of flooding are abnormal amounts of rainfall and sudden thawing of snow or ice, storms and snow levels can be monitored to provide short-term flood prediction.
Frequency of Flooding
In your homework exercise you will see how flood frequencies can be determined for any given stream if data is available for discharge of the stream over an extended period of time.
Such data allows statistical analysis to determine how often a given discharge or stage of a river is expected. From this analysis a recurrence interval can be determined and a probability calculated for the likelihood of a given discharge in the stream for any year.
The data needed to perform this analysis are the yearly maximum discharge of a stream from one gaging station over a long enough period of time.
In order to determine the recurrence interval, the yearly discharge values are first ranked.
Each discharge is associated with a rank,
m,with m = 1
given to the maximum discharge over the years of record,m = 2
given to the second highest discharge,m = 3
given to the third highest discharge, etc.The smallest discharge will receive a rank equal to the number of years over which there is a record,
n
Thus, the discharge with the smallest value will havem = n
The number of years of record,
n
, and the rank for each peak discharge are then used to calculate recurrence interval,R
by the following equation, called the Weibull equation:R = (n+1)/m
A graph is then made plotting discharge for each year of the record versus recurrence interval.
The graph usually plots recurrence interval on a logarithmic scale.
An example of such a plot is shown here for the Red River of the North gaging station at Fargo, North Dakota.
A best-fit line is then drawn through the data points. From the best-fit line, one can determine the discharge associated with the a flood with a recurrence interval of say 10 years.
This would be called the 10-year flood.
For the data on the Red River, above, the discharge associated with the 10-year flood is about 12,000 cubic feet per second. Similarly the discharge associated with a flood with a recurrence interval of 50 years (the 50-year flood) would have a discharge of about 21,000 cubic feet per second. The 100 -year flood would have a discharge of about 25,000 cubic feet per second.
Note that for the Red River data, shown above, the April 18, 1997 flood had a discharge of 30,000 ft3/sec, which is equivalent to a 250-year flood. Also note that a flood that reached a similar stage occurred on the Red River in Fargo in the year 1887, only 110 years before. Does this make the statistical analysis unreliable? The answer is no. As we shall see, it is possible to have two 100-year floods occurring 100 years apart, 50 years apart, or even 2 in the same year.
The probability, Pe, of a certain discharge can be calculated using the inverse of the Weibull equation:
Pe = m/(n+1)
The value,
Pe
, is called the annual exceedence probability. For example, a discharge equal to that of a 10-year flood would have an annual exceedence probability of 1/10 = 0.1 or 10%.This would say that in any given year, the probability that a flood with a discharge equal to or greater than that of a 10 year flood would be 0.1 or 10%. Similarly, the probability of a flood with discharge exceeding the 100 year flood in any given year would be 1/100 = 0.01, or 1%.
Note that such probabilities are the same for every year.
So, for example, the probability that discharge of the Red River at Fargo, North Dakota will exceed 25,000 ft3/sec (the discharge of the 100-year flood) this year or any other year would 1%.
You can think of this in the same way you would think about rolling dice. The probability on any roll that you will end up with a six, rolling only on die, is 1 in 6 or 16.67%. Each time you roll that one die the probability is the same, although you know that it is possible to roll two or three sixes in a row.
Thus, it is important to remember that even though a 250-year flood occurred in Fargo in 1997, there is still a 1% probability that such a flood, or one of even greater magnitude, will occur this year.
Flood Hazard Mapping
Food hazard mapping is used to determine the areas susceptible to flooding when discharge of a stream exceeds the bank-full stage. Using historical data on river stages and discharge of previous floods, along with topographic data, maps can be constructed to show areas expected to be covered with floodwaters for various discharges or stages.
In constructing such maps aerial photographs and satellite images of prior floods are studied to help to determine the areas that would be covered.
The illustration above shows a possible hazard map based on estimated discharges or river stages for a hypothetical 10-year flood, 50-year flood, and 100-year flood. In addition, scale models are often constructed of areas prone to flooding.
Such models only work if they are kept up to date with current flood prevention structures and drainage modifications.
Monitoring the Progress of Storms
If factors such as amount of rainfall, degree of ground saturation, degree of permeable soil, and amount of vegetation can be determined, then these can be correlated to give short-term prediction, in this case called a forecast, of possible floods.
If a forecast is issued, then a flood warning can be communicated to warn the public about the possible extent of the flood, and to give people time to move out of the area.
Such forecasts are very useful for flooding that has a long lag time between the storm and the peak discharge.
Flash floods, which characteristically have short lag times, are more problematical.
Thus, in some areas known to be susceptible to flash floods, a flash flood warning is often issued any time heavy rainfall is expected because there is always the chance of a flash food accompanying heavy rainfall.
In conjunction with the National Weather Service, various agencies in the U.S. provide information on the internet that forecast potential floods. You will look at one such system in your homework (http://www.earthsat.com/flood/floodwat.html ).
Human Intervention
Humans can modify the landscape in many ways. Sometimes humans attempt to modify drainage systems to prevent flooding, but sometimes these efforts have adverse effects and actually help to cause flooding in other areas. Any modification of the landscape has the potential to cause changes in the drainage system, and such changes can have severe consequences.
Channel Modifications
Humans often decide that a stream should flow along a specified path for such reasons as flood control, enhancement of drainage, control of erosion, increasing access to the floodplain for development, or improvement of the appearance of the channel. Such channel modifications involve measures such as the straightening the channel, deepening or widening the channel, clearing vegetation from the banks, or lining the channel with concrete. These modifications are referred to as channelization.
In order to control floods, channel modification should involve increasing the channel cross-sectional area, so that higher discharge will not increase the stage of the river.Straighter channels also allow higher velocity flow and, enable the stream to drain faster when discharge increases. Lining the channel with concrete provides a smoother surface over which the water can flow, thereby reducing friction and also increasing the velocity of the stream.
While channelization for flood control may reduce the incidence of flooding in the channelized area, it often results in more severe flooding both upstream and downstream from the channelized area.
Channelization can also interfere with the natural habitat of the stream system and decrease the aesthetic value of the stream (see figure 8.22, page 211 in your text).
Channelization, or any other modification of a stream system, changes the validity of all historic data collected over the years on that stream.
During flooding of the Mississippi River in 1973 and 1993 water levels rose to higher levels than expected from the statistical data, because modification of the stream had made the data invalid.
The 1973 flood caused damage and rose to levels that might be expected from a 200-year flood, even though discharge was only at a level predicted for a 30-year flood. Thus, it appears that modifications of the drainage system had an adverse effect.
Effects of Development on Flood Hazard
Whenever humans modify the landscape in any way changes are to be expected in the way water drains from the land. Unless careful consideration is given to the possible drainage consequences, such landscape modifications can result in higher incidence of flooding.
Development on floodplains should therefore be undertaken only with great care.
Existing developments that have enhanced flooding problems are often costly to fix. Among the factors that enhance the flood potential are:
Channelization - As noted above, most channelization is undertaken to reduce flood hazards. But, channelization is also undertaken to allow development on the floodplain.
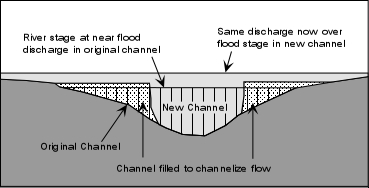
If the channelization results in decreasing the cross-sectional area of the stream, as in the example above, then the same discharge that may not have produced flooding prior to channelization, may overflow the banks and cause extensive flooding after channelization.
- Subsidence - As noted in previous lectures, subsidence often results in developed areas due to compaction of the sediment, both due to the increasing weight of structures and hydrocompaction associated with the lowering of the water table. Any time the elevation of an area is lowered, it becomes subject to collection of more water, and in severe cases, could drastically change the drainage pattern.
- Storm Sewers - In order to collect run off from streets, parking lots, and buildings, all of which block the infiltration of water into the soil, storm sewers are installed to provide underground drainage of the surface. While this may prevent local flooding of streets, it moves water more rapidly to the major stream systems and thus decreases the lag time and increases the peak discharge of the streams collecting the runoff from the storm sewers.
Reduction of infiltration - Any time the surface materials of the Earth are covered with impermeable materials like concrete, asphalt, or buildings, the infiltration of water into the soil is prevented. Urbanization tends to reduce infiltration, and thus water must collect in storm sewers and eventually in the main drainage systems. Thus, extensive urbanization also decreases the lag time and increases the peak discharge even further. Urbanization can therefore lead to a higher incidence of flash floods.
Organized Response to Flood Hazards
Response to flood hazards can be attempted in two main ways: An engineering approach, to control flooding, and a regulatory approach designed to decrease vulnerability to flooding.
Engineering Approaches
- Channel modifications - As discussed above, channelization. can enlarge cross-sectional area and thus create a situation where a higher stage is necessary before flooding. In other words by enlarging the cross-sectional area, higher discharge can be held within the channel. Channelization also increases water velocity, and thus reduces drainage time.
- Dams - Dams can be used to hold water back so that discharge downstream can be regulated at a desired rate. Human constructed dams have spillways that can be opened to reduce the level of water in the reservoir behind the dam. Thus, the water level can be lowered prior to a heavy rain, and more water can be trapped in the reservoir and released later at a controlled discharge.
- Retention ponds - Retention ponds serve a similar purpose to dams. Water can be trapped in a retention pond and then released at a controlled discharge to prevent flooding downstream.
- Levees, Dikes, and Floodwalls - These are structures built along side the channel to increase the stage at which the stream floods. Some controversy has developed concerning the use of such structures. For example, during the 1993 floods on the upper Mississippi River, the city of St. Louis was prevented from flooding by closing the floodwalls. This essentially narrowed the river channel as it passed St. Louis and caused slowing of the River. Because of the restricted channel, flood waters were forced to flow into areas both upstream and downstream from St. Louis, perhaps increasing the damage in the these areas.
Floodways - Floodways are areas that can be built to provide an outlet to a stream and allow it flood into an area that has been designated as a floodway. Floodways are areas where no construction is allowed, and where the land is used for agricultural or recreational purposes when there is no threat of a flood, but which provide an outlet for flood waters during periods of high discharge. The Bonnet Carrie Spillway west of New Orleans is such a floodway. During low stages of the Mississippi River the land between the River and Lake Ponchartrain is used for recreational purposes - hunting, fishing, and dirt bike riding for example. During high stages of the River when there is a potential for the River to rise to flood stage in New Orleans, the spillway is opened so that water drains into Lake Ponchartrain. This lowers the level of water in the Mississippi and reduces the possibility of a levee break or water overtopping the levee.
Reduction of Vulnerability
With a better understanding of the behavior of streams, the probability of flooding, and areas likely to be flooded during high discharge, humans can undertake measures to reduce vulnerability to flooding. Among the non-structural measures are:
- Floodplain zoning - Laws can be passed that restrict construction and habitation of floodplains. Instead floodplains can be zoned for agricultural use, recreation, or other uses wherein lives and property are not endangered when (note that I did not use the word if) flood waters re-occupy the floodplain.
- Floodplain building codes - Structures that are allowed within the floodplain could be restricted those that can withstand the high velocity of flood waters and are high enough off the ground to reduce risk of contact with water.
- Floodplain buyout programs - In areas that have been recently flooded, it may be more cost effective for the government, which usually pays for flood damage either through subsidized flood insurance or direct disaster relief, to buy the rights to the land rather than pay the cost of reconstruction and then have to pay again the next time the river floods.
- Mortgage limitations - Lending institutions could refuse to give loans to buy or construct dwellings or businesses in flood prone areas.Typewritten answers to the following questions should be turned in by the due date (April 6).
Flood frequency information can be determined from knowledge of the peak discharge (highest discharge) in any given year provided enough years worth of information has been collected. This allows one to relate the expected recurrence interval for a given discharge, and determine the probability that a flood of a given discharge will occur in any given year. The recurrence interval for a given discharge can be calculated by first ranking the discharges.
In the table below for Dry Creek. Louisiana, fill in the Rank column. To do this, enter a 1 for the maximum discharge that has occurred during the 20 years of available data. The second highest discharge will be given a rank of 2, etc. with the lowest discharge given a value of 20.
| Date | Discharge (m3/sec) | Rank, m | Recurrence Interval, R |
|---|---|---|---|
| 13-Mar-75 |
990 |
||
| 06-Mar-76 |
1450 |
||
| 28-Feb-77 |
1650 |
||
| 04-Mar-78 |
3190 |
||
| 22-Mar-79 |
2150 |
||
| 03-Mar-80 |
1090 |
||
| 12-Mar-81 |
1250 |
||
| 01-Feb-82 |
950 |
||
| 04-Apr-83 |
1550 |
||
| 02-May-84 |
1350 |
||
| 16-Mar-85 |
1100 |
||
| 06-Jul-86 |
2700 |
||
| 21-Feb-87 |
1220 |
||
| 30-Jan-88 |
1710 |
||
| 16-Mar-89 |
1800 |
||
| 21-Feb-90 |
1500 |
||
| 12-May-91 |
1880 |
||
| 08-Apr-92 |
2400 |
||
| 01-Mar-93 |
2030 |
||
| 08-Feb-94 |
1300 |
- After you have filled in the Rank column, you can now calculate the
recurrence interval for each peak discharge.
The recurrence interval,R
, is given by the Weibull Equation:
R = (n+1)/m
where n is the number of years over which the data was collected (20 years in this case) and m is the rank of each peak discharge. Use this equation to calculate the recurrence interval for each peak discharge. - Next, use the graph below to plot a graph of discharge ( on the
y-axis) versus recurrence interval (on the x-axis).
Note that the x-axis is a logarithmic scale, and thus you should try to estimate as best you can where the data point will fall between the lines on the graph.
Once you have plotted the points use a ruler to draw the best fit straight line through the data points (that is lay a ruler on the graph and try to draw a line that most closely approximates all of the data points).
Do not draw lines that connect individual data points.
Make sure you turn in the completed table above and the graph below. -
- By extrapolating your line on the graph, determine the peak discharge expected in a flood with a recurrence interval of 50 years and 100 years. These are the discharges expected in a 50 year flood and a 100 year flood.
- From reading of your text and lecture notes, is it possible that discharges associated with a 100 year flood could occur 5 years apart, 10 years apart, or even one year apart?
- The annual exceedence probability, Pe, is the probability that a
given discharge will occur in a given year. It is calculated as
the inverse of the recurrence interval,
R:
-
Pe = 1/R
- Thus, the probability that a flood with a ten year recurrence interval will occur in any year is 1/10 = 0.1 or 10%. What are the probabilities that a 50 year flood and a 100 year flood will occur in any given year?
- The mean annual discharge can be calculated by summing the peak annual discharges and dividing by the number of years. What is the mean annual discharge for Dry Creek?
- Flood stage, or bankfull stage on Dry Creek occurs at a discharge of 1800 m3/sec. What is the recurrence interval of such a discharge according to your graph?
Someone has offered to sell you a 4-bedroom 2-story house with a 2 car garage and swimming pool on a 1 acre lot on a relatively flat piece of ground on the banks of Dry Creek for what seems like a reasonable price of $50,000.
The last time the house was flooded it cost $30,000 to repair the flood damage. How often has the house been flooded in the last 20 years?
What is the probability that the house will be flooded in the first year that you own it?
Would you still consider buying the house? Why or why not?
Imagine that in your future work as an executive for an insurance company that you have been reassigned to head up the Fargo, North Dakota office of your company, Denyallclaims Insurance, Inc. You are aware that in 1997 the Red River of the North, which runs through Fargo, crested at the highest level recorded in this century, and you are concerned about buying property and living in the area of Fargo. One of the other executives in your company has an uncle that lives in Fargo, and he assures you that while flooding was severe in 1997, this was a 250 year flood, and such a flood will not occur for another 250 years! You know from taking this class that his statement is hogwash, so you decide to check out the discharge history of the Red River in Fargo on the internet. Because you took a course in natural disasters, you know that if you visit the web site of the U.S.G.S. Water Resources Division:http://waterdata.usgs.gov/nwis-w/US/ you can obtain discharge data from thousands of gaging stations throughout the United States. Since you want information for Fargo, North Dakota, you click on the appropriate state on the web page.
This allows you to search the NWIS data base for a particular gaging station in North Dakota, if you know the number of the station. Since you don't know the number of the station, you are going to have to search all stations in North Dakota for the particular one in Fargo on the Red River.
Click on the appropriate link to get a listing of all stations in North Dakota.
Once this list comes up, use the "find" function of your browser to search for Fargo, or simply browse the list until you find "Red River of the North at Fargo, ND" (station number 05054000).
Click on this link. This will bring up the page for the Fargo gaging station.
On this page you want to obtain historical stream flow daily values, so click on that link.
This brings up a page that will allow you to retrieve data over a particular interval of time.
Note that records are available from 06/01/1901 to 09/30/1998.
You want to look at this data over a shorter period of time, so in the "Dates to Retrieve" boxes type in 01-01-1968 to 01-01-1998, to get a graphs showing daily discharge over this 30 year period.
Make sure that you have selected the buttons to select an output format of Graph and Large Graph, then click on the "Retrieve Data" button bar. The site is rather slow, but eventually a graph will appear that shows discharge on a daily basis versus time for the 30 year period.
Look at the graph.
Floodstage for this gaging station is about
3500 ft3/sec.
Over this 30 year period, how many times has the Red River exceeded flood stage?
In what year did the highest discharge occur, and what was the value of that discharge?
Notice that there seems to be a periodicity to where the peaks of high discharge occur on the hydrograph (that is the distance between peak discharge points are approximately equally spaced).
In order to better understand what may be the cause of this periodicity, and perhaps the cause of the flooding,
click on the "Back" button to return to the data retrieval page.
Now ask to retrieve data over a shorter period of time, this time use range between 01-01-1968 to 01-01-1978. Click on the "Retrieve Data" button again, and look at the graph that is eventually displayed. What is your best estimate the approximate month or months in which the peak discharge occurs in each year of this 10 year period?
Knowing that North Dakota is in the northern part of the United States, why do you think that the peak discharge occurs in this month or range of months?
- To find out more about floods on the Red River of the North go to
the 1997 Fargo Flood Home Page:
http://www.ndsu.nodak.edu/fargoflood/ then page down to the link - General Information on Flooding in the Red River Basin.
Now answer the question - What makes the Red River Valley so prone to flooding? - What precautions should you take in choosing your home and home site in the Fargo area if you decide to move there to head up the Denyallclaims office in Fargo?
Go back to the USGS water resources data base page:
http://waterdata.usgs.gov/nwis-w/US/
We next want to look at some data for the area of Rapid Creek, South Dakota.
So, choose South Dakota as the site to search.
This time we know the station number that we want - it is 06414000.
If you enter this number into the data retrieval box, a screen for the stream gage on Rapid Creek at Rapid City, S. Dakota will come up.
Rapid creek drains the area of the Black Hills, which is a spectacular tourist site.
On Friday, June 9, 1972 shortly after 6 PM a severe thunderstorm dropped about 15 inches of rain on the Black Hills over a period of 6 hours. You want to see what the effects of this thunderstorm were on Rapid Creek in Rapid City.
So on the Rapid Creek page, click on the "historical stream flow daily values" link, and choose to retrieve data for the period between 06-07-1972 and 06-12-1972. Note that the graph only reports one value of discharge for each day, so it is difficult to know exactly what time the peak discharge occurred on the June 10. Other data suggest that the peak discharge occurred on about 6:00 AM on the morning of June 10th, and the rain ended at 11:59 PM on June 9.
- What was the value of peak discharge on June 10th?
By what percentage did this peak discharge exceed the normal discharge (assuming normal discharge is 200 cfs)? - Approximately what was the lag time between the end of the rainstorm and the peak disc
- This flood killed 238 people.
Why do you think it was it so costly in terms of human lives? - What kind of flood was this?
One of theses sites is Earthsat's Floodwatch:
http://www.earthsat.com/flood/floodwat.html
Go to this site and click on the link to "Floodcast".
- On the "Floodcast" page, choose the link to "FloodThreat" and then
choose the link to the "Floodcast QPF forecasts".
This will load a map that shows a color coded quantitative precipitation forecast for the United States. What areas of the United States are likely to receive the most rain in the next 24 hours [give your answer by state name(s)]?
For the areas that are forecast to receive the most rain, how much rain is expected?
Be sure to also state the date on which this forecast is valid. (Note, if you don't know the states of the U.S. by their shape, you should also consult another map of the U.S.that shows state names while you are looking at the Floodcast map so that you can state exactly which states are forecast to receive the most rainfall). - Now go back to FloodThreat Page by hitting the "Back" button on your
browser.
Now click on the link to the "United States Map".
This loads a map of the U.S. that shows the amount of rain in a 3 hour period necessary to cause flooding.
Using your answer to question a, are any of the areas expected to receive enough rain to cause flooding?
If so, which areas and how much rain is necessary to cause flooding in these areas.
Make sure you answer this question on the same day that you answered question a. - Return to the FloodThreat Page by hitting the "Back" button on your
browser.
On the FloodThreat Page, choose the link to "FloodRisk".
Then, choose the "United States Map".
This will load a map of the United States, updated daily, that shows areas where there are various levels of risk for flooding, or where the National Weather Service has already issued a flood warning or flood watch.
Do any of the areas you listed in questions a and b show moderate to high risk of a flood in the next day or are any of these areas currently under a flood watch or warning?
If so, state which areas.
Note that you may find this set of pages useful in the future if you are concerned about the possibility of flooding in the area where you live.