Origins of Extreme Weather
Origins of Extreme Weather
adapted to the Southern Hemisphere from the lecture notes of Prof. Stephen A. Nelson
.
see also Cyclone Larry Category 5 -- we were there!
Earth Science
Australia's exclusive photos!...
see also Tropical
Cyclones...
see also Cyclone
Larry Category 5 Analysis...
Water and Heat
Air Masses
Fronts and Mid-latitude
Cyclones
Thunderstorms
Hail
Lightning
Tornadoes
Tornado Intensity
Tornado Frequency
Tornado Safety
Tropical Cyclones
(Hurricanes)
Origin of Tropical Cyclones
Hurricane Structure (Northern
Hemisphere)
Changes in Cyclone Tracks and
Intensities
Tropical Cyclone Size
Cyclone Damage Enhanced
by High Tides
Storm Surges
Drought and Famine
El Niño
This page covers the following weather related phenomenon: severe thunderstorms, tornadoes, tropical cyclonic storms (hurricanes, typhoons, and cyclones), nor'easters, drought, and the causes and effects of El Niño.
Water and Heat

Water has one of the highest heat capacities of all known substances. This means that it takes a lot of heat to raise the temperature of water by just one degree. Water thus absorbs a tremendous amount of heat from solar radiation, and furthermore, because solar radiation can penetrate water easily, large amounts of solar energy are stored in the world's oceans.
Further energy is absorbed by water vapor as the latent heat of vaporization, which is the heat required to evaporate water or change it from a liquid to a vapor. This latent heat of vaporization is given up to the atmosphere when water condenses to form liquid water as rain. If the rain changes to a solid in the form of snow or ice, it also releases a quantity of heat known as the latent heat of fusion.
Thus, both liquid water and water vapor are important in absorbing heat from solar radiation and transporting and redistributing this heat around the planet.
Air Masses
Due to general atmospheric circulation patterns, air masses containing differing amounts of heat and moisture move into and across North America. Polar air masses, containing little moisture and low temperatures move downward from the poles. Air masses that form over water are generally moist, and those that form over the tropical oceans are both moist and warm. Because of the Coreolis effect due to the Earth's rotation, air masses generally move from west to east. But, because of the differences in moisture and heat, the collision of these air masses can cause instability in the atmosphere.
Fronts and Mid-latitude Cyclones
Different air masses with different temperatures and moisture content, in general, do not mix when they run into each other, but instead are separated from each other along boundaries called fronts.
When cold air moving up from the poles encounters warm moist air moving down from the tropics, a cold front develops and the warm moist air rises above the cold front. This rising moist air cools as it rises causing the condensation of water vapor to form rain or snow. Note that the cold air masses tend to circulate around a low pressure center in a counterclockwise fashion in the northern hemisphere and clockwise in the southern hemisphere. Such circulation around a low pressure center is called a mid-latitude cyclone.
When warm air moving northward meets the cooler air to the north, a warm front forms. As the warm air rises along a gently inclined warm front, clouds tend to form, and can also cause rain, but rain is less likely because the warm front is not as steep as a cold front. If the rapidly moving cold front overtakes the warm front, an occluded front forms, trapping warm air above a layer of cold and cool air. Mid-latitude cyclones and their associated fronts are responsible for such severe weather conditions as thunderstorms, snow storms and associated hail, lightening, and occasional tornadoes.
Thunderstorms
Thunderstorms occur anywhere that warm moist air has absorbed enough heat to make the air less dense than the surrounding air. This commonly occurs along cold fronts, but can occur in other places as well, particularly where daytime heating forms hot air near the Earth's surface. As the warm moist air rises it begins to cool and water begins to condense into tiny droplets that form clouds.
Condensation of the water droplets in the clouds releases the latent heat of evaporation, adding heat to the rising air, thus decreasing its density and allowing it to rise to higher levels in the atmosphere. This rising air, called an updraft, starts to build clouds to heights of up to 6 km.
Further rising and cooling within the clouds causes more condensation, as well as the formation of ice crystals which release further latent heat and build cloud heights up to 12 km. Eventually the water droplets and ice crystals in the clouds become so large that they can no longer be supported by the uprising air mass, and they begin to fall forming rapid downdrafts on the leading edge of the cloud.
In the mature stage of thunderstorm development updrafts and downdrafts operate side by side within the cloud. This is the most dangerous stage of a thunderstorm because of the high winds accompanying the downdrafts, the heavy rain, as well as thunder, lightening, and possible hail and tornado development.
Eventually the cloud reaches the dissipating stage as the downdrafts drag in so much cool dry air that it prevents further updrafts of warm moist air. With lack of updrafts of warm moist air, the cloud begins to dissipate and eventually it stops raining
Thunderstorms can form as single cells, with only one cloud mass, or as multiple cells, with several clouds moving along a similar path.
Although thunderstorms can occur nearly everywhere, they show an unequal distribution over Australia. Areas that receive the highest number of thunderstorms are areas where warm moist air moves southward from the tropics.
Hail
Hail is a rain of semi-spherical, concentrically layered ice balls th`t are dropped from some thunderstorms. Hail rarely kills people, but it does heavy damage to agriculture, roofs, and automobiles. The conditions necessary to form hail during a thunderstorm are:Large thunderstorms with high cloud tops formed from hot moist rising air. Upper level cold air with a large temperature contrast between the upper level air and the rising moist air. Strong updrafts within the thunderstorm to keep hailstones suspended in the cloud while layers of ice are added to the stones. When the stones become too large to be suspended by the cloud they fall to the surface as hail. Although thunderstorms are most common along the Gulf coast, thunderstorms that produce hail are more common in the mid-continent region where temperature contrasts between upper air masses and the rising hot air are greater. Hail can range from pea-size stones to grapefruit size stones.Lightning
Lightning is the electrical discharge from clouds that causes thunder. Thus, lightning occurs from all thunderstorms. lightning is the major cause of forest fires and results in many deaths. Deaths from lightning have a similar distribution to the occurrence of thunderstorms, with Florida having both the most thunderstorms and the most lightning deaths.Deaths from lightning usually occur outdoors as seen in the following table:
| Locations of Lightning Strikes (USA) | |
|---|---|
| Open fields, sport fields |
26% |
| Under trees | 15% |
| On boats & in water-related activity | 12% |
| On tractors & heavy road equipment | 6% |
| Golf courses | 5% |
| Via telephone | 1% |
| Unspecified | 35% |
Lightning is caused by an imbalance of electrical charge between and within clouds and the ground. Most of you have simulated lightning by walking across a carpet on a dry day and then touching a metal object like a door knob. Static electrical charge builds on your body and is discharged to the door knob as a bolt of electricity. During the buildup of a thundercloud, charged particles of water droplets and ice become separated in the cloud. Positively charged particles are moved to the top of the cloud and negatively charged particles are moved to the bottom of the cloud.
The thundercloud then begins to interact with the ground. The negatively charged part of the cloud induces a build-up of positive charges on the ground. Similarly beneath the upper positively charged part of the cloud negative charges are induced in the ground below. When the difference in voltage between the oppositely charged parts of the cloud and the ground become great enough, the electricity is discharged as a bolt of lightning.
Note that lightning can travel from the cloud to the ground, from the ground to the cloud, and within the cloud itself. lightning travels at speeds of about 160,000 km/h (100,000 miles per hour), and usually includes several strokes that all occur within about 1/2 of a second. The discharge of electricity during a bolt of lightning heats up the air surrounding the bolt causing rapid expansion of the air. It is this rapid expansion of the air that causes the sound we call thunder.
Tornadoes
Tornadoes are funnel shaped clouds that are associated with thunderstorms. Tornadoes have wind velocities higher than hurricanes (up to 500 km/hr [318 miles per hour]), but affect a much smaller area than hurricanes. Tornadoes are mostly found in inland areas with high convection rates.
Tornado Development
- A tornado develops within a severe thunderstorm when there is an excessive amount of vertical wind shear. Vertical wind shear is when upper level winds are blowing at a high velocity relative to lower level winds. Prior to the development of the thunderstorm strong high level winds blowing to the west initiates a spinning flow near the Earth's surface. This spinning flow takes the form of an invisible horizontally oriented cylinder. As the thunderstorm develops, strong updrafts of warm air lifts this rotating air into a more vertical position within the thundercloud, causing part of the thundercloud to rotate around the a vortex in a counterclockwise direction. Tornadoes form within this rotating air, usually at the rear flank of the thunderstorm, and extend down from the thundercloud occasionally reaching the surface. They travel at velocities between stationary and 110 km/hr, with cyclonic wind speeds up to 500 km/hr as noted above. The diameters of tornadoes range from a few tens of meters up to 1.5 km. They do not often remain in contact with the ground for long periods of time, but can skip across the surface as the thunderstorm moves along.
Tornado Intensity
- The intensity of a tornado is classified by the Fujita tornado intensity scale shown in the table below| Fujita Tornado Intensity Scale | ||
|---|---|---|
| F0 - F1 | F2 - F3 | F4 - F5 |
| Weak Tornado | Strong Tornado | Violent Tornado |
| F0 | 40-72 mph | Gale tornado Light damage. Some damage to chimneys; break branches off trees; push over shallow-rooted trees; damage sign boards. |
| F1 | 73-112 mph | Moderate tornado Moderate damage. The lower limit is the beginning of hurricane wind speed; peel surface off roofs; mobile homes pushed off foundations or overturned; moving autos pushed off the roads. |
| F2 | 113-157 mph | Significant tornado Considerable damage. Roofs torn off frame houses; mobile homes demolished; boxcars pushed over; large trees snapped or uprooted; light-object missiles generated. |
| F3 | 158-206 mph | Severe tornado. Severe damage. Roofs and some walls torn off well-constructed houses; trains overturned; most trees in forest uprooted; heavy cars lifted off the ground and thrown. |
| F4 | 207-260 mph | Devastating tornado Devastating damage. Well-constructed houses leveled; structures with weak foundations blown off some distance; cars thrown and large missiles generated. |
| F5 | 261-318 mph | Incredible tornado. Incredible damage. Strong frame houses lifted off foundations and carried considerable distance to disintegrate; automobile sized missiles fly through the air in excess of 100 meters(109 yds); trees debarked; incredible phenomena will occur. |
| F6 - F12 |
319 mph - MACH 1 (the speed of sound) |
The maximum wind speeds of tornadoes are not expected to reach the F6 wind speeds. |
Tornado Frequency
- Tornadoes have occured throughout Australia. Because they are associated with strong thunderstorms, the frequency of tornadoes is closely related to the areas that have lots of thunderstorms, but also occur predominantly in the interior and southern plains where cold air from Anarctica encounters warm air moving southward. It is these contrasting air masses and their common paths of circulation which give rise to both the thunderstorms and the tornadoes. Tornadoes are most common during the spring and summer months. They often occur as swarms associated with cold fronts.- Tornado Damage - Tornado damage is caused by the high wind speed and high difference in atmospheric pressure between the tornado and its surroundings. The rotating winds can knock down weaker structures, and the extremely low pressure inside the tornado generates strong pressure differences between the inside and outside of buildings. This pressure difference causes roofs to be lifted and removed. The high winds pick up smaller objects including small structures, animals, people, cars, and especially mobile homes, and can carry these objects up to several kilometers. The debris picked up by the winds become rapidly moving projectiles that can become lethal when hurled against a human body.
- Tornado Prediction and Warning - Tornadoes cannot be predicted with precision. However, when strong thunderstorm activity is detected, a tornado watch is generally issued for all areas that may fall in the path of the thunderstorm. Doppler radar can detect rotating motion within a thunderstorm and when this is detected, or a tornado is actually observed, a tornado warning is issued for all areas that may fall in the path of the thunderstorm.
Tornado Safety
- If at home:
- Go at once to the basement, storm cellar, or the lowest level of the building
- If there is no basement, go to an inner hallway or a smaller inner room without windows, such as a bathroom or closet.
- Get away from the windows.
- Go to the center of the room. Stay away from corners because they tend to attract debris.
- Get under a piece of sturdy furniture such as a workbench or heavy table or desk and hold on to it. Use arms to protect head and neck.
- If in a mobile home, get out and find shelter elsewhere.
- If at work or school:
- Go to the basement or to an inside hallway at the lowest level.
- Avoid places with wide-span roofs such as auditoriums, cafeterias, large hallways, or shopping malls.
- Get under a piece of sturdy furniture such as a workbench or heavy table or desk and hold on to it. Use arms to protect head and neck.
- If outdoors:
- If possible, get inside a building.
- If shelter is not available or there is no time to get indoors, lie in a ditch or low-lying area or crouch near a strong building. Be aware of the potential for flooding. Use arms to protect head and neck.
- If in a car:
- Never try to out drive a tornado in a car or truck. Tornadoes can change direction quickly and can lift up a car or truck and toss it through the air.
- Get out of the car immediately and take shelter in a nearby building. If there is no time to get indoors, get out of the car and lie in a ditch or low-lying area away from the vehicle. Be aware of the potential for flooding.
- After the tornado:
- Help injured or trapped persons Give first aid when appropriate. Don't try to move the seriously injured unless they are in immediate danger of further injury. Call for help.
- Turn on radio or television to get the latest emergency information.
- Stay out of damaged buildings. Return home only when authorities say it is safe.
- Use the telephone only for emergency calls.
- Clean up spilled medicines, bleaches, or gasoline or other flammable liquids immediately.
- Leave the buildings if you smell gas or chemical fumes.
- Take pictures of the damage--both to the house and its contents--for insurance purposes.
- Remember to help your neighbors who may require special assistance--infants, the elderly, and people with disabilities.
- Inspecting utilities in a damaged home:
- Check for gas leaks--If you smell gas or hear a blowing or hissing noise, open a window and quickly leave the building. Turn off the gas at the outside main valve if you can and call the gas company from a neighbor's home.
- If you turn off the gas for any reason, it must be turned back on
by a professional.
Because tornadoes can strike anywhere and anytime there are thunderstorms, the best mitigation is for an educated populace to be aware of the conditions under which tornadoes develop and heed any tornado watches or warnings that are issued by a responsible agency, and practice the tornado safety tips listed above. The only other mitigation that can reduce the damage produced by tornadoes is building codes that require structures to be constructed with extra reinforcing of wood frames and masonry.
Tropical Cyclones (Hurricanes)
Hurricanes are massive tropical cyclonic storm systems with winds exceeding 119 km/hr (74 miles/hour). The same phenomena is given different names in different parts of the world. In the western Pacific they are called typhoons, and in the southern hemisphere they are called cyclones. But no matter where they occur they represent the same process. Hurricanes are dangerous because of their high winds, the storm surge produced as they approach a coast, and the severe thunderstorms associated with them. Although death due to hurricanes has decreased in recent years due to better methods of forecasting and establishment of early warning systems, the economic damage from hurricanes has increased as more and more development takes place along coastlines. It should be noted that coastal areas are not the only areas subject to hurricane damage. Although hurricanes loose strength as they move over land, they still carry vast amounts of moisture onto the land causing thunderstorms with associated flash floods and mass-wasting hazards.Origin of Tropical Cyclones
When a cold air mass is located above an organized cluster of tropical thunderstorms, an unstable atmosphere results. (This is called a tropical wave). This instability increases the likelihood of convection, which leads to strong updrafts that lift the air and moisture upwards, creating an environment favorable for the development of high, towering clouds. A tropical disturbance is born when this moving mass of thunderstorms maintains its identity for a period of 24 hours or more. This is the first stage of a developing hurricane.
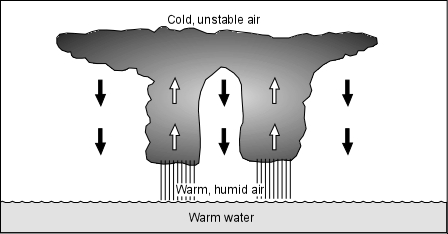
Surface convergence (indicated by the small horizontal arrows in the diagram below) causes rising motion around a surface cyclone (labeled as "L"). The air cools as it rises (vertical arrows) and condensation occurs. The condensation of water vapor to liquid water releases the latent heat latent heat condensation into the atmosphere. This heating causes the air to expand, forcing the air to diverge at the upper levels (horizontal arrows at cloud tops)
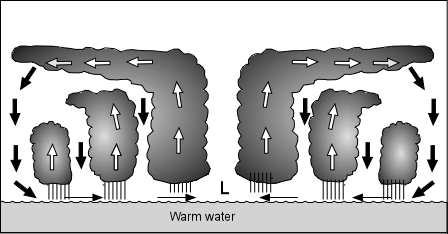
- Since pressure is a measure of the weight of the air above an area, removal of air at the upper levels subsequently reduces pressure at the surface. A further reduction in surface pressure leads to increasing convergence (due to an higher pressure gradient), which further intensifies the rising motion, latent heat release, and so on. As long as favorable conditions exist, this process continues to build upon itself. When cyclonic circulation begins around the central low pressure area, and wind speeds reach 62 km/hr (39 mi/hr) the disturbance is considered a tropical storm and is given a name. When wind speeds reach 119 km/hr (74 mi/hr) it becomes a hurricane. Note that all tropical waves, disturbances, or storms do not necessarily develop into hurricanes.
- Warm ocean waters (of at least 26.5°C [80°F]) throughout about the upper 50 m of the tropical ocean must be present. The heat in these warm waters is necessary to fuel the tropical cyclone.
- The atmosphere must cool fast enough with height, such that it is potentially unstable to moist convection. It is the thunderstorm activity which allows the heat stored in the ocean waters to be liberated for tropical cyclone development.
- The mid-troposphere (5 km [3 mi]), must contain enough moisture to sustain the thunderstorms. Dry mid levels are not conducive to the continuing development of widespread thunderstorm activity.
- The disturbance must occur at a minimum distance of at least 500 km [300 mi] from the equator. For tropical cyclonic storms to occur, there is a requirement that the Coreolis force must be present. Remember that the Coreolis effect is zero near the equator and increases to the north and south of the equator. Without the Coreolis force, the low pressure of the disturbance cannot be maintained.
- There must be a pre-existing near-surface disturbance that shows convergence of moist air and is beginning to rotate. Tropical cyclones cannot be generated spontaneously. They require a weakly organized system that begins to spin and has low level inflow of moist air.
- There must be low values (less than about 10 m/s [20 mph]) of vertical wind shear between the surface and the upper troposphere. Vertical wind shear is the rate of change of wind velocity with altitude. Large values of vertical wind shear disrupt the incipient tropical cyclone by removing the rising moist air too quickly, preventing the development of the tropical cyclone. Or, if a tropical cyclone has already formed, large vertical shear can weaken or destroy it by interfering with the organization around the cyclone center.
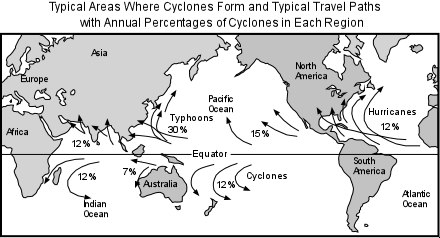
Note that about 12% of all tropical cyclones develop in the Atlantic Ocean. Those that begin to form near the coast of Africa are often referred to as "Cape Verde" hurricanes, because the area in which they develop is near the Cape Verde Islands. 15% of all tropical cyclones develop in the eastern Pacific Ocean, 30% develop in the western Pacific Ocean, 24% in the Indian Ocean both north and south of the equator, and 12% develop in the southern Pacific Ocean. It is notable that essentially no tropical cyclones develop south of the Equator in the Atlantic Ocean.
Hurricane Structure (Northern Hemisphere)
Because the converging winds spiral inward toward the central low pressure area, the winds rotate in a clockwise direction around the central low in the southern hemisphere (counterclockwise in the northern hemisphere). As these winds spiral inward they draw in the thunderclouds around the storm, creating the spiral rain bands that are clearly visible on satellite images
(Northern Hemisphere)
As the winds converge toward the central core, they spiral upwards, sending warm moist air upwards. As this air rises, it cools and releases its latent heat into the atmosphere to add further energy to the storm. The winds spiraling around this central core create the eye of the tropical cyclone and eventually spread out at high altitudes. Eventually, cool air above the eye begins to sink into the central core. This dry descending air within the eye gives the core a clear, cloud free sky, with little to no wind.
Since the main source of energy for the storm is the heat contained in the warm tropical and subtropical oceans, if the storm moves over the land, it is cut off from its source of heat and will rapidly dissipate.
(Northern Hemisphere)Winds spiraling counterclockwise (in the northern hemisphere) into the eye of the hurricane achieve high velocities as they approach the low pressure of the eye. The velocity of these winds is called the hurricane-wind velocity. The central low pressure center of the eye also moves across the surface of the Earth as it is pushed by regional winds. The velocity at which the eye moves across the surface is called the storm center velocity. Thus, when we consider the velocity of winds around the hurricane we must take into account both the wind velocity and the storm center velocity. Depending on the side of the hurricane, these velocities can either add or subtract. In the example at the left, the hurricane is traveling north with a storm center velocity of 30 km/hr, and a hurricane-wind velocity of 150 km/hr. On the right hand side of the storm both velocities are to the north so the total wind velocity is 180 km/hr (30 + 150). On the left hand side of the storm, however, the wind is blowing to the south. Thus, since the storm is moving in the opposite direction to the winds, the velocities subtract and the total wind velocity is 120 km/hr (150 - 30). This is an important point. Winds are always stronger on the right side of a moving hurricane in the northern hemisphere. The opposite is true in the southern hemisphere, since winds circulate in a clockwise direction, the winds are stronger on the left-hand side of the storm in the southern hemisphere).
Tropical Cyclone Size
Since winds spiral inward toward the central low pressure area in the eye of a hurricane, hurricane-wind velocity increases toward the eye. The distance outward from the eye to which hurricane strength winds occur determines the size of the hurricane. Winds in the eye wall itself have the highest velocity and this zone can extend outward from the center to distances of 16 to 40 km. Hurricane force winds (winds with velocities greater than 119 km/hr) can extend out to 120 km from the center of the storm. The largest tropical cyclone recorded, Typhoon Tip, had gale force winds (54 km/hr) which extended out for 1100 km in radius in the Northwest Pacific in 1979.
The smallest, Cyclone Tracy, had gale force winds that only extended 50 km in radius when it struck Darwin, Australia, in 1974. There is very little association between hurricane intensity (either measured by maximum sustained winds or by central pressure) and size. Hurricane Andrew is a good example of a very intense tropical cyclone of small size. It had 922 mb central pressure and 230 km/hr sustained winds at landfall in Florida, but had gale force winds extending out to only about 150 km from the center.
Hurricane Intensity and Frequency
Once a hurricane develops, the Saffir-Simpson Scale is used to classify a hurricane's intensity and damage potential. There are five possible categories. Category 1 storms are more common than category 5 storms. In a typical year, there may be many category 1 storms, but category 5 storms occur very infrequently.
| Saffir-Simpson Hurricane Damage-Potential Scale | ||||
|---|---|---|---|---|
| Scale Number Category |
Central Pressure mb (inches of mercury) |
Wind Speeds mi/hr (km/hr) |
Storm Surge feet (meters) |
Observed Damage |
| 1 | >980 (>28.94) |
74-95 (119-153) |
4-5 (1.2-1.5) |
some damage to trees, shrubbery, and unanchored mobile homes |
| 2 | 965-979 (28.50-28.91) |
96-110 (154-177) |
6-8 (1.8-2.4) |
major damage to mobile homes; damage buildings' roofs, and blow trees down |
| 3 | 945-964 (27.91-28.47) |
111-130 (178-209) |
9-12 (2.5-3.6) |
destroy mobile homes; blow down large trees; damage small buildings |
| 4 | 920-944 (27.17-27.88) |
131-155 (210-249) |
13-18 (3.9-5.5) |
completely destroy mobile homes; lower floors of structures near shore are susceptible to flooding |
| 5 | <920 (<27.17) |
>155 (>250) |
>18 (>5.5) |
extensive damage to homes and industrial buildings; blow away small buildings; lower floors of structures within 500 meters of shore and less than 4.5 m (15 ft) above sea level are damaged |
- Ships at sea transmit weather reports that help meteorologists locate centers of low pressure that may develop into tropical disturbances.
- Images from weather satellites, which are collected every 30 minutes, are then scanned to look for any development or growth of the disturbance. In particular, the images are examined to detect any rotational development of the storm, an indication that it may be approaching tropical storm strength.
- If a tropical storm or hurricane is detected and appears to pose a threat to land areas, observation airplanes are sent to examine the storm. Such planes fly into the storm at an altitude of about 3,000 meters or lower. The plane collects data on wind speed, air pressure, and moisture content by dropping devices called dropsondes into the storm. These dropsondes transmit the meteorological data continuously has they fall to the ocean surface, and thus provide information on the vertical structure of the storm. In addition, radar devices carried on the plane collect data about the intensity of the rainfall and wind velocities. The planes fly completely through the storm, passing though the eye, sometimes making several passes. The data collected give meteorologists a 3 dimensional picture of the structure of the storm.
- Satellite images and radar from land based stations allow scientists to track the position of the storm and report it to all agencies that may be affected if the storm makes landfall
Changes in Cyclone Tracks and Intensities
Because cyclones are influenced by large-scale air masses, they sometimes move along rather erratic paths. Cyclones are especially influenced by the strength and direction of upper level winds. As noted above, strong upper level winds create a vertical wind shear that cause the top of the cyclone to be sheared of and result in the loss of strength of the storm. The erratic nature of a hurricanes path often make it difficult to predict where and when it will make landfall prior to several hours before it actually does make landfall. In the lower latitudes, near the equator, cyclones generally are pushed by the westerly (easterly in Northern Hemisphere) trade winds and have storm center velocities that are relatively low (8 to 32 km/hr). As they move southward (northward in the Northern Hemisphere), storm center velocities generally increase to greater than 50 km/hr. If the cyclone encounters a low pressure trough between two high pressure centers, it is steered into the trough and follows it along a southwestward trend (northeastward in the Northen Hemisphere), increasing its velocity as it does so.
Angle of Cyclone Approach to Coast
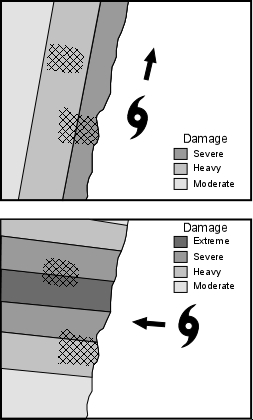
The amount of damage that occurs when a hurricane approaches a coast depends on the angle of approach.
Two extreme examples of Hurricanes illustrate this point.
A hurricane that moves along the coast has a coast-parallel hurricane track. From such a track extensive damage would occur along the coastline closest to the storm, with bands of lesser damage extending inland. Since this track (upper diagram) has the most intense winds offshore (on the right side of the hurricane), the coast would not feel the highest wind velocities. Thunderstorm activity associated with this track would be most severe on the northern side of the storm, since the spiral rain bands would be feeding off the moist air above the ocean.
A hurricane that approaches the perpendicular to the coast has a coast-normal track. Such a storm would produce extreme damage all along the right-hand side of its track, with bands of decreasing damage occurring both to the left and right of the track. Furthermore, as the storm approached the coast areas to right hand side of the storm would receive the heaviest thunderstorm activity, since the rain bands would be feeding off the moist oceanic air.
Cyclone Damage Enhanced by High Tides
Cyclones cross the Queensland coast most often in January, Februrary and March
a time that corresponds to the highest tides of the year. The combination of Storm Surges caused by the wind and pressure differences and high tides results in exceptionally hig water
Storm Surges
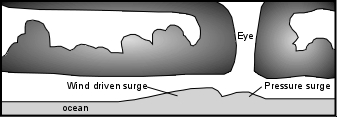
Heavy winds produced by hurricanes push the ocean in front of them. As this water gets pushed into the shallow zones along the coastline sea level rises. Since the storm surge is driven by the winds, the height of the rise in sea level is related to the velocity of the wind. For a moving storm the greater winds occur on the right side of the storm (in the northern hemisphere). Sea level also rises beneath the eye of the storm due to the low pressure in the eye. But, the surge generated by this low pressure is usually much less than the wind-driven surge. The height of the storm surge depends on wind speed, the shape of the coastline, and variations in the water depth along the coast line. Height also depends on tidal cycles. If a storm approaches the coast during high tide, the storm surge will be higher than if it approaches during low tide. Category 5 tropical cyclones can produce storm surges in excess of 6m (20 feet). The highest storm surge measured, 12.8 m (42 feet) occurred in 1899 in Australia.
Because the storm surge occurs ahead of the eye of the storm, the surge will reach coastal areas long before the hurricane makes landfall. This is an important point to remember because flooding caused by the surge can destroy roads and bridges making evacuation before the storm impossible.
Since thunderstorms accompany hurricanes, and these storms can strike inland areas long before the hurricane arrives, water draining from the land in streams and estuaries may be impeded by the storm surge that has pushed water up the streams and estuaries.
It is also important to remember that water that is pushed onto the land by the approaching storm (the flood surge) will have to drain off after the storm has passed. Furthermore after passage of the storm the winds typically change direction and push the water in the opposite direction. Damage can also be caused by the retreating surge, called the ebb surge.
Along coastal areas with barrier islands offshore, the surge may first destroy any bridges leading to the islands, and then cause water to overflow the islands. Barrier islands are not very safe places to be during an approaching hurricane!
Hurricane Damage
Hurricanes cause damage as a result of the high winds, the storm surge, heavy rain, and tornadoes that are often generated from the thunderstorms as they cross land areas. Strong winds can cause damage to structures, vegetation, and crops, as described in the Saffir-Simpson scale discussed previously. The collapse of structures can cause death. The storm surge and associated flooding, however, is what is most responsible for casualties. Extreme cases of storm surge casualties have occurred as recently as 1970 and 1990 in Bangladesh.Bangladesh is an area with high population density and with over 30% of the land surface less than 6 m above sea level. In 1970 a cyclone struck Bangladesh during the highest high tides (full moon). The storm surge was 7 m (23 ft.) high and resulted in about 400,000 deaths. Another cyclone in 1990 created a storm surge 6 m high and resulted in 148,000 deaths.
The amount of damage caused by a tropical cyclone is directly related to the intensity of the storm, the duration of the storm (related to its storm-center velocity, as discussed above), the angle at which it approaches the land, and the population density along the coastline. The table below shows how damages are expected to increase with increasing tropical storm category. Like the Richter scale for earthquakes, damage does not increase linearly with increasing hurricane category.
| Category | Relative Damage | Median Damage (1990 Dollars) |
|---|---|---|
| 1 | 1 | $24 million |
| 2 | 4 | $218 million |
| 3 | 40 | $1.1 billion |
| 4 | 120 | $2.3 billion |
| 5 | 240 | $6.9 billion |
Predicting Hurricane Frequency and Intensity
As discussed above, modern methods of weather forecasting involving satellites, radar, etc. allow accurate tracking of the development and paths of hurricanes. In addition, computer models have been developed that enable the prediction of storm surge levels along the coast, given data on wind velocity, wind distribution, and storm center velocity. Computer models have also been developed to predict the paths the storms will take and have met with moderate success. Accurate forecasting of storm tracks is more problematical because of the numerous variables involved and the erratic paths hurricanes sometimes take.
Drought and Famine
In contrast to the exceptional weather conditions we have discussed so far, which tend to bring high quantities of rainfall, a drought is a period of time of abnormal dryness in a region. Droughts are slow onset hazards that may lead to secondary effects like famine In Australia, droughts are caused when upper level air flow creates a long lasting high pressure ridge over the central region. The high pressure causes cyclonic flow bringing dry air down to the surface. As this air sinks in the high pressure areas it warms and the relative humidity decreases further. Thus the air is so undersaturated with water that it sucks up even more water from the surface. Such persistent high pressure zones block the flow of warm moist air preventing storms that would normally bring rain.
El Niño
One of the dramatic manifestations of the interaction between the oceans
and the atmosphere and its effects on both climate and weather is the
Southern Oscillation, one of the consequences of which is El Niño.
The Southern Oscillation is a back and forth variation in atmospheric
pressure between a high pressure system normally located off the west
coast of South America and a low pressure system normally located in the
western Pacific near Indonesia and Australia. In the U.S. El Niño
conditions result in heavy rains, flooding, landslides, and
tornadoes in greater than normal amounts because El Niño conditions drive
abnormal amounts of moist warm air across North America. El Niño causes
flooding in Peru, as well as drought and fires in Indonesia and Australia.
The phenomena is manifested by the arrival of warm water off the coast of Peru around Christmas time, and thus is called El Niño (Spanish for the boy child) because it arrives at this time. An El Niño event occurs every 2 to 7 years with various degrees of strength. Some El Niño events are more intense than others, and the condition lasts from 18 to 24 months. The following table lists the years of El Niño events.
| El Niño Years | |||
|---|---|---|---|
| 1902-1903 | 1905-1906 | 1911-1912 | 1914-1915 |
| 1918-1919 | 1923-1924 | 1925-1926 | 1930-1931 |
| 1932-1933 | 1939-1940 | 1941-1942 | 1951-1952 |
| 1953-1954 | 1957-1958 | 1965-1966 | 1969-1970 |
| 1972-1973 | 1976-1977 | 1982-1983 | 1986-1987 |
| 1991-1992 | 1994-1995 | 1997-1998 |
"Normal" Conditions"
- Under "normal" conditions the easterly trade winds, driven by the pressure difference between the eastern Pacific high and the western Pacific low and blowing toward the equator, push warm water toward the equator and across the Pacific Ocean toward Australia and Indonesia. This causes a pool of warm water to form near the equator in the western Pacific. It also causes the thermocline (the boundary between warm waters in the upper layers of the ocean and the cold deep waters below) to move closer to the surface off the coast of South America, bringing nutrient-rich waters to surface by upwelling. Such nutrient-rich waters help sustain large fish populations. The upwelling cold water cools the atmosphere above, and prevents rain clouds from forming off the coast of Peru.
The warm water pushed to the west by the trade winds, heats as it flows along the equator, so that on arrival in the western Pacific heat is added to the overlying atmosphere causing it to rise, form clouds, and produce extensive rainfall. The moisture depleted upper atmosphere then circulates back to east where it descends off the coast of South America contributing to the dry conditions. During periods of exceptionally strong trade winds the upwelling of cold water off the South America cools the water even further creating a condition called La Niña (girl child).
"El Niño Conditions"
- During El Niño periods there is a weakening of the easterly trade winds and the warm waters of the western Pacific are pushed toward the east. This causes the thermocline in the eastern Pacific to sink, preventing the upwelling of cold waters from below, depleting the waters in nutrients, and thus leading to starvation of fish populations. As the warm water shifts eastward so does the development of atmospheric disturbances that lead to upwelling of the atmosphere to form thunderstorms. Rising bodies of moist air thus occur closer to the coast of the Americas, leading to increased storminess, not only in South America, but in North America as well. These low pressure systems that develop in the eastern Pacific can move over the continent and cause severe weather as noted above.
In addition, they create upper level winds that tend to shear the tops off of developing tropical storms and hurricanes in the Atlantic Ocean and Gulf of Mexico, leading to a decrease in the number of intense tropical cyclones that develop in these regions.
La Niña conditions have about the opposite effect of El Niño conditions. i.e. better fishing harvests off the west coast of South America, drier conditions in North and South America, more hurricanes in the Atlantic, and wetter conditions in Australia and Indonesia.
Over the past 50 years, the oscillation of warm water back and forth across the tropical Pacific Ocean has created El Niño conditions 31% of the time, La Niña conditions 23% of the time, and "normal" conditions 46% of the time.
Prediction of El Niño
As can be seen from the data presented above, the southern oscillation which creates the El Niño condition has operated throughout the last century. Archeological evidence from South America indicates that the oscillation has been operating for thousands of years. Still, it has only been in recent years that atmospheric and ocean scientists have become aware of the phenomenon, and then only because particularly strong El Niños occurred in the years 1982-83 and 1997-98 causing considerable damage from natural disasters in North America.
The frequency of El Niño events and the intensity of the events is not statistically predictable. In other words we do not as yet know when the next El Niño will occur. This is due to the relatively short amount of historical data currently available. Still, the 1997-98 event and its intensity were predictable several months beforehand because measurements of sea surface temperature from satellites and instrument buoys in the Pacific Ocean were able to identify the movement warm surface waters from east to west across the Pacific Ocean.
Thus, future El Niño events will likely be predictable several months before they actually develop. This could have important economic consequences. For example, knowing that an El Niño event is coming could result in farmers in normally dry parts of South America preparing the soil for a good crop months in advance because of the expected wetter weather in the months ahead. Fishermen could begin preparing for a poor fishing harvest off the coast of South America. In terms of Natural disasters, Peru was much better prepared for the 1997-98 El Niño and constructed storm drains and stockpiled emergency supplies, probably saving thousands of lives.
It is important to remember that because the southern oscillation shifts back and forth, some areas receive beneficial aspects of the phenomenon while other areas receive adverse aspects.